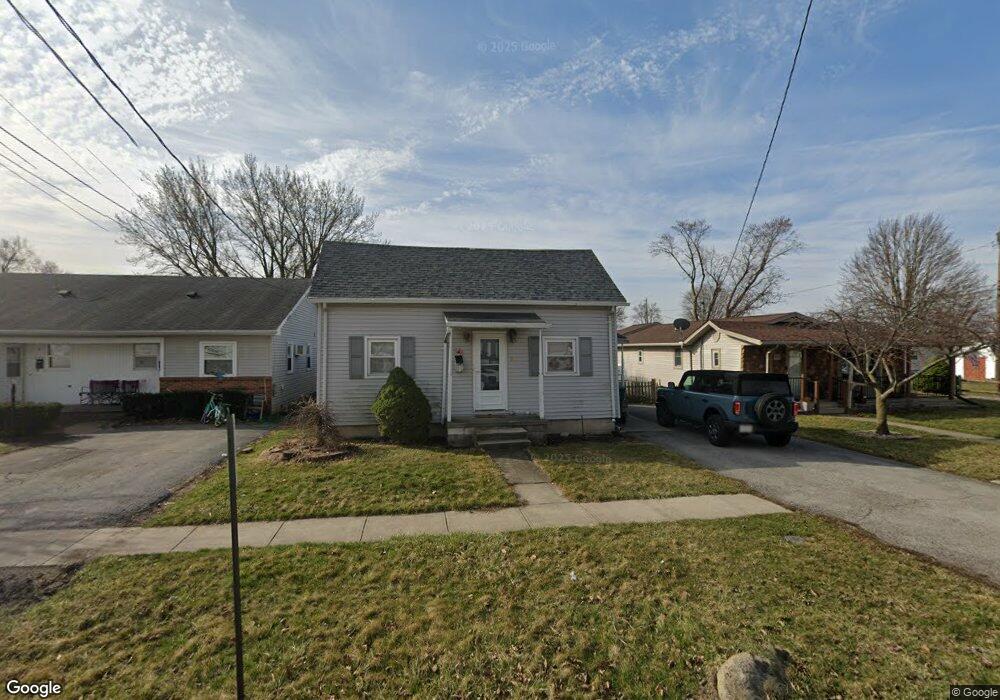
731 Swing Ave Findlay, OH 45840
Estimated Value: $124,767 - $148,000
3
Beds
1
Bath
882
Sq Ft
$156/Sq Ft
Est. Value
About This Home
This home is located at 731 Swing Ave, Findlay, OH 45840 and is currently estimated at $137,942, approximately $156 per square foot. 731 Swing Ave is a home located in Hancock County with nearby schools including Northview Elementary School, Bigelow Hill Elementary School, and Glenwood Middle School.
Ownership History
Date
Name
Owned For
Owner Type
Purchase Details
Closed on
Apr 16, 2007
Sold by
Baker Richard A
Bought by
Baker David O
Current Estimated Value
Purchase Details
Closed on
Aug 28, 2003
Sold by
Hamilton Alberto T and Hamilton Kimberly A
Bought by
Baker David O and Baker Patsy L
Home Financials for this Owner
Home Financials are based on the most recent Mortgage that was taken out on this home.
Original Mortgage
$61,600
Interest Rate
4.5%
Mortgage Type
Purchase Money Mortgage
Purchase Details
Closed on
Mar 3, 1999
Sold by
Griffin Barbara
Bought by
Hamilton Alberto and Hamilton Kimberly
Home Financials for this Owner
Home Financials are based on the most recent Mortgage that was taken out on this home.
Original Mortgage
$57,500
Interest Rate
6.83%
Mortgage Type
New Conventional
Create a Home Valuation Report for This Property
The Home Valuation Report is an in-depth analysis detailing your home's value as well as a comparison with similar homes in the area
Home Values in the Area
Average Home Value in this Area
Purchase History
| Date | Buyer | Sale Price | Title Company |
|---|---|---|---|
| Baker David O | $103,766 | Assured Title Agency | |
| Baker David O | $77,000 | Assured Title | |
| Hamilton Alberto | $57,500 | -- |
Source: Public Records
Mortgage History
| Date | Status | Borrower | Loan Amount |
|---|---|---|---|
| Previous Owner | Baker David O | $61,600 | |
| Previous Owner | Hamilton Alberto | $57,500 |
Source: Public Records
Tax History
| Year | Tax Paid | Tax Assessment Tax Assessment Total Assessment is a certain percentage of the fair market value that is determined by local assessors to be the total taxable value of land and additions on the property. | Land | Improvement |
|---|---|---|---|---|
| 2024 | $1,218 | $33,420 | $5,600 | $27,820 |
| 2023 | $1,220 | $33,420 | $5,600 | $27,820 |
| 2022 | $1,216 | $33,420 | $5,600 | $27,820 |
| 2021 | $1,191 | $28,510 | $5,600 | $22,910 |
| 2020 | $1,191 | $28,510 | $5,600 | $22,910 |
| 2019 | $1,167 | $28,510 | $5,600 | $22,910 |
| 2018 | $959 | $21,490 | $4,740 | $16,750 |
| 2017 | $480 | $21,490 | $4,740 | $16,750 |
| 2016 | $957 | $21,490 | $4,740 | $16,750 |
| 2015 | $800 | $17,780 | $4,740 | $13,040 |
| 2014 | $800 | $17,780 | $4,740 | $13,040 |
| 2012 | $806 | $17,780 | $4,740 | $13,040 |
Source: Public Records
Map
Nearby Homes
- 705 Swing Ave
- 719 Davis St
- 605 Davis St
- 421 Clifton Ave
- 528 Rector Ave
- 405 Clifton Ave
- 243 Monroe Ave
- 341 Defiance Ave
- 724 Edith Ave
- 701 W Melrose Ave
- 140 Monroe Ave
- 925 W Melrose Ave
- 146 Clifton Ave
- 217 Prentiss Ave
- 0 County Road 223
- 239 Edith Ave
- 315 W Melrose Ave
- 2318 Anna St
- 206 Midland Ave
- 2419 Hollybrook Dr
Your Personal Tour Guide
Ask me questions while you tour the home.