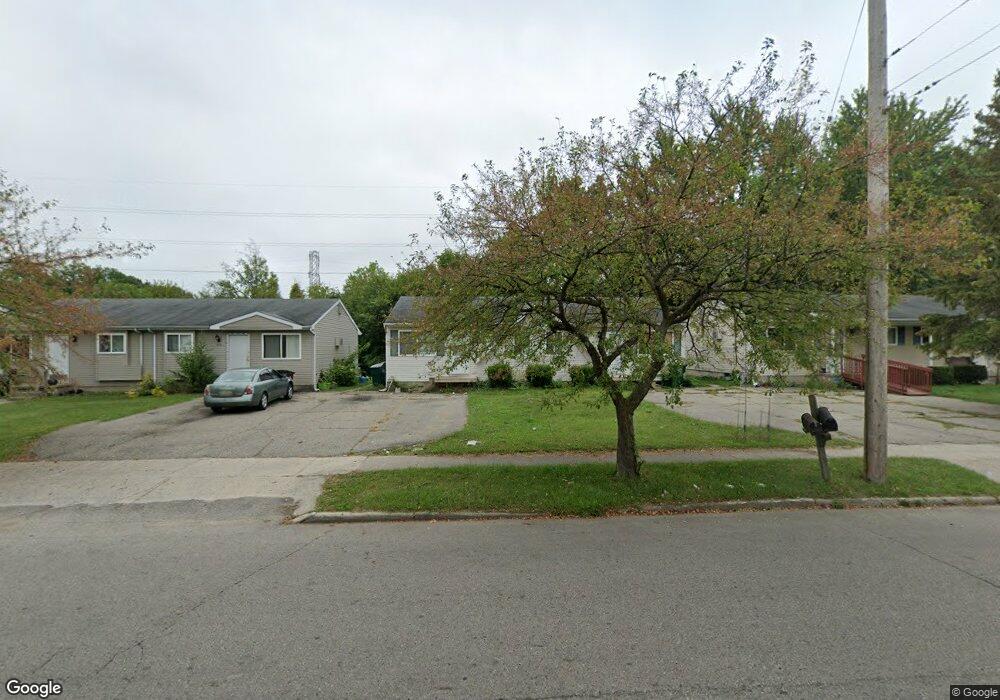
734 Armstrong Rd Lansing, MI 48911
Southern Lansing NeighborhoodEstimated Value: $145,353 - $232,000
4
Beds
2
Baths
1,494
Sq Ft
$116/Sq Ft
Est. Value
About This Home
This home is located at 734 Armstrong Rd, Lansing, MI 48911 and is currently estimated at $173,588, approximately $116 per square foot. 734 Armstrong Rd is a home located in Ingham County with nearby schools including Kendon School, Attwood School, and Everett High School.
Ownership History
Date
Name
Owned For
Owner Type
Purchase Details
Closed on
Mar 19, 2010
Sold by
Sullivan James M and Sullivan Mary L
Bought by
Spotlight Realty Llc
Current Estimated Value
Purchase Details
Closed on
Nov 3, 2009
Sold by
Sullivan James M and Sullivan Mary L
Bought by
Sullivan James M and Sullivan Mary L
Purchase Details
Closed on
Sep 6, 2001
Sold by
Woodside E & D Llc
Bought by
Sullivan James M and Sullivan Mary L
Home Financials for this Owner
Home Financials are based on the most recent Mortgage that was taken out on this home.
Original Mortgage
$77,500
Interest Rate
6.97%
Mortgage Type
Purchase Money Mortgage
Purchase Details
Closed on
Nov 25, 1998
Sold by
Norman Norma E
Bought by
Woodside E& D L.L.C.
Create a Home Valuation Report for This Property
The Home Valuation Report is an in-depth analysis detailing your home's value as well as a comparison with similar homes in the area
Home Values in the Area
Average Home Value in this Area
Purchase History
| Date | Buyer | Sale Price | Title Company |
|---|---|---|---|
| Spotlight Realty Llc | $66,000 | First American Title Ins Co | |
| Sullivan James M | $1,886,409 | First American Title Ins Co | |
| Sullivan James M | -- | None Available | |
| Sullivan James M | $112,500 | -- | |
| Woodside E& D L.L.C. | $186,500 | -- |
Source: Public Records
Mortgage History
| Date | Status | Borrower | Loan Amount |
|---|---|---|---|
| Previous Owner | Sullivan James M | $77,500 |
Source: Public Records
Tax History
| Year | Tax Paid | Tax Assessment Tax Assessment Total Assessment is a certain percentage of the fair market value that is determined by local assessors to be the total taxable value of land and additions on the property. | Land | Improvement |
|---|---|---|---|---|
| 2025 | $3,669 | $66,100 | $10,900 | $55,200 |
| 2024 | $30 | $67,700 | $10,900 | $56,800 |
| 2023 | $3,457 | $62,700 | $10,900 | $51,800 |
| 2022 | $3,162 | $54,400 | $10,200 | $44,200 |
| 2021 | $3,089 | $46,800 | $7,000 | $39,800 |
| 2020 | $3,067 | $43,500 | $7,000 | $36,500 |
| 2019 | $2,958 | $41,700 | $7,000 | $34,700 |
| 2018 | $2,809 | $35,500 | $7,000 | $28,500 |
| 2017 | $2,697 | $35,500 | $7,000 | $28,500 |
| 2016 | $3,527 | $34,900 | $7,000 | $27,900 |
| 2015 | $3,527 | $33,900 | $13,943 | $19,957 |
| 2014 | $3,527 | $46,400 | $17,428 | $28,972 |
Source: Public Records
Map
Nearby Homes
- 5008 Southgate Ave
- 1109 Barr Ave
- 4719 S Pennsylvania Ave
- 208 E Northrup St
- 1101 Kendon Dr
- 125 E Northrup St
- 4608 Alpha St
- 205 E Jolly Rd Unit 6
- 201 E Syringa Dr
- 115 E Claremore Dr
- 600 E Cavanaugh Rd
- 0 Glenwood Ave
- 522 E Cavanaugh Rd
- 5009 Kessler Dr
- 817 Jessop Ave
- 709 Jessop Ave
- 111 E Potter Ave
- 601 Jessop Ave
- 810 Fenton St
- 419 W Jolly Rd
- 740 Armstrong Rd
- 730 Armstrong Rd
- 800 Armstrong Rd
- 724 Armstrong Rd
- 806 Armstrong Rd
- 718 Armstrong Rd
- 743 Armstrong Rd
- 812 Armstrong Rd
- 712 Armstrong Rd
- 5326 Granger Dr
- 706 Armstrong Rd
- 818 Armstrong Rd
- 5320 Granger Dr
- 801 Armstrong Rd
- 700 Armstrong Rd
- 5314 Granger Dr
- 5329 Granger Dr
- 830 Armstrong Rd Unit 17
- 5316 Granger Dr
- 832 Armstrong Rd Unit 16
Your Personal Tour Guide
Ask me questions while you tour the home.