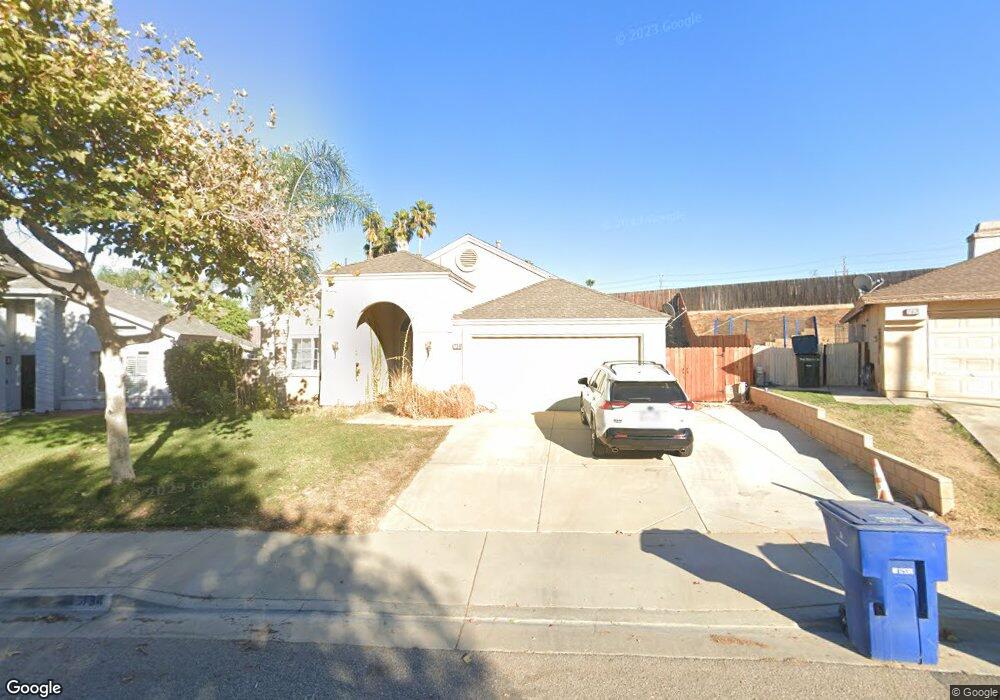
734 Blake Rd Riverside, CA 92501
Northside NeighborhoodEstimated Value: $495,000 - $652,000
3
Beds
2
Baths
1,250
Sq Ft
$473/Sq Ft
Est. Value
About This Home
This home is located at 734 Blake Rd, Riverside, CA 92501 and is currently estimated at $591,469, approximately $473 per square foot. 734 Blake Rd is a home located in Riverside County with nearby schools including Fremont Elementary School, University Heights Middle School, and John W. North High School.
Ownership History
Date
Name
Owned For
Owner Type
Purchase Details
Closed on
Nov 22, 2000
Sold by
Osborne Development Corp
Bought by
Ortega Brian J and Ortega Roxanne Y
Current Estimated Value
Home Financials for this Owner
Home Financials are based on the most recent Mortgage that was taken out on this home.
Original Mortgage
$141,761
Outstanding Balance
$51,602
Interest Rate
7.71%
Mortgage Type
FHA
Estimated Equity
$539,867
Create a Home Valuation Report for This Property
The Home Valuation Report is an in-depth analysis detailing your home's value as well as a comparison with similar homes in the area
Home Values in the Area
Average Home Value in this Area
Purchase History
| Date | Buyer | Sale Price | Title Company |
|---|---|---|---|
| Ortega Brian J | $143,500 | Fidelity National Title Co |
Source: Public Records
Mortgage History
| Date | Status | Borrower | Loan Amount |
|---|---|---|---|
| Open | Ortega Brian J | $141,761 | |
| Closed | Ortega Brian J | $4,302 |
Source: Public Records
Tax History
| Year | Tax Paid | Tax Assessment Tax Assessment Total Assessment is a certain percentage of the fair market value that is determined by local assessors to be the total taxable value of land and additions on the property. | Land | Improvement |
|---|---|---|---|---|
| 2025 | $2,778 | $260,786 | $60,257 | $200,529 |
| 2023 | $2,778 | $250,662 | $57,918 | $192,744 |
| 2022 | $2,243 | $203,591 | $56,783 | $146,808 |
| 2021 | $2,221 | $199,600 | $55,670 | $143,930 |
| 2020 | $2,204 | $197,555 | $55,100 | $142,455 |
| 2019 | $2,162 | $193,682 | $54,020 | $139,662 |
| 2018 | $2,119 | $189,885 | $52,962 | $136,923 |
| 2017 | $2,081 | $186,163 | $51,924 | $134,239 |
| 2016 | $1,948 | $182,513 | $50,906 | $131,607 |
| 2015 | $1,919 | $179,774 | $50,143 | $129,631 |
| 2014 | $1,899 | $176,254 | $49,161 | $127,093 |
Source: Public Records
Map
Nearby Homes
- 421 Devener St
- 1091 Clark St
- 3444 W Center St Unit 7
- 3444 W Center St Unit 24
- 3444 W Center St Unit 23
- 3444 W Center St Unit 25
- 3444 W Center St Unit 43
- 3444 W Center St Unit 8
- 3444 W Center St Unit 19
- 3444 W Center St Unit 21
- 3444 W Center St Unit 13
- 3444 W Center St Unit 12
- 3444 W Center St Unit 10
- 3444 W Center St Unit 26
- 1115 Clark St
- 250 Stephens Ave
- 3469 Columbia Ave
- 8044 Country Mile Ln
- 1195 W Spring St
- 217 Iowa Ave
- 726 Blake Rd
- 742 Blake Rd
- 718 Blake Rd
- 735 Blake Rd Unit Rm 2
- 735 Blake Rd Unit Rm 3
- 735 Blake Rd Unit Rm 1
- 735 Blake Rd Unit Rm 6
- 750 Blake Rd
- 710 Blake Rd
- 743 Blake Rd
- 728 Kelly Ln
- 736 Kelly Ln
- 758 Blake Rd
- 751 Blake Rd
- 704 Blake Rd
- 744 Kelly Ln
- 3273 Jake Dr
- 752 Kelly Ln
- 759 Blake Rd
- 695 W La Cadena Dr
Your Personal Tour Guide
Ask me questions while you tour the home.