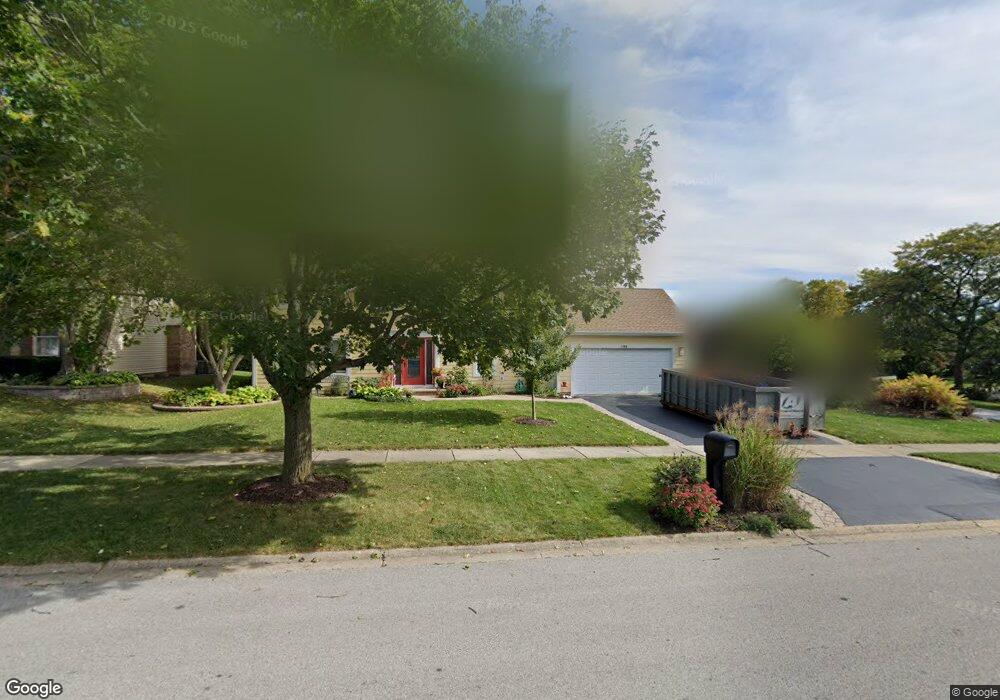
734 Raintree Dr Unit 2 Naperville, IL 60540
Watts NeighborhoodEstimated Value: $594,000 - $701,000
4
Beds
3
Baths
2,728
Sq Ft
$244/Sq Ft
Est. Value
About This Home
This home is located at 734 Raintree Dr Unit 2, Naperville, IL 60540 and is currently estimated at $666,555, approximately $244 per square foot. 734 Raintree Dr Unit 2 is a home located in DuPage County with nearby schools including May Watts Elementary School, Charlestown Middle School, and Thayer J. Hill Middle School.
Ownership History
Date
Name
Owned For
Owner Type
Purchase Details
Closed on
Nov 15, 1998
Sold by
Scheetz Doug D and Scheetz Christine M
Bought by
Tromblay Daniel V and Tromblay Kathryn A
Current Estimated Value
Home Financials for this Owner
Home Financials are based on the most recent Mortgage that was taken out on this home.
Original Mortgage
$210,000
Outstanding Balance
$46,685
Interest Rate
6.8%
Estimated Equity
$619,870
Purchase Details
Closed on
Mar 23, 1998
Sold by
Gardner Vance F and Gardner Jane B
Bought by
Scheetz Doug D and Scheetz Christine M
Home Financials for this Owner
Home Financials are based on the most recent Mortgage that was taken out on this home.
Original Mortgage
$229,500
Interest Rate
7.2%
Create a Home Valuation Report for This Property
The Home Valuation Report is an in-depth analysis detailing your home's value as well as a comparison with similar homes in the area
Home Values in the Area
Average Home Value in this Area
Purchase History
| Date | Buyer | Sale Price | Title Company |
|---|---|---|---|
| Tromblay Daniel V | $262,166 | -- | |
| Scheetz Doug D | $255,000 | -- |
Source: Public Records
Mortgage History
| Date | Status | Borrower | Loan Amount |
|---|---|---|---|
| Open | Tromblay Daniel V | $210,000 | |
| Previous Owner | Scheetz Doug D | $229,500 |
Source: Public Records
Tax History Compared to Growth
Tax History
| Year | Tax Paid | Tax Assessment Tax Assessment Total Assessment is a certain percentage of the fair market value that is determined by local assessors to be the total taxable value of land and additions on the property. | Land | Improvement |
|---|---|---|---|---|
| 2024 | $11,418 | $198,920 | $50,270 | $148,650 |
| 2023 | $10,881 | $178,740 | $45,170 | $133,570 |
| 2022 | $10,851 | $169,770 | $42,560 | $127,210 |
| 2021 | $10,345 | $163,710 | $41,040 | $122,670 |
| 2020 | $10,331 | $163,710 | $41,040 | $122,670 |
| 2019 | $9,908 | $155,700 | $39,030 | $116,670 |
| 2018 | $9,580 | $148,430 | $36,890 | $111,540 |
| 2017 | $9,661 | $141,370 | $35,640 | $105,730 |
| 2016 | $9,486 | $135,670 | $34,200 | $101,470 |
| 2015 | $9,397 | $128,810 | $32,470 | $96,340 |
| 2014 | $9,217 | $122,270 | $30,570 | $91,700 |
| 2013 | $9,196 | $123,120 | $30,780 | $92,340 |
Source: Public Records
Map
Nearby Homes
- 7S410 Arbor Dr
- 1262 Rhodes Ln Unit 2701
- 1114 Tennyson Ln
- 319 Claremont Ct
- 1208 Tennyson Ln
- 417 River Bluff Cir
- 479 River Bend Rd Unit 111
- 480 Village Green Rd
- 134 S Whispering Hills Dr
- 122 Encina Dr
- 1099 W Jefferson Ave
- 891 Lowell Ln
- 1259 Natchez Trace Cir
- 511 Aurora Ave Unit 108
- 509 Aurora Ave Unit 209
- 1033 Emerald Dr
- 316 Hemlock Ln
- 845 Tulip Ln
- 2459 Emerson Ln
- 21 Forest Ave
- 730 Raintree Dr
- 738 Raintree Dr
- 705 Kathy Ct
- 726 Raintree Dr
- 754 Raintree Dr
- 701 Kathy Ct
- 1356 Goldenrod Dr
- 739 Raintree Dr
- 743 Raintree Dr
- 747 Raintree Dr
- 722 Raintree Dr
- 709 Kathy Ct
- 751 Raintree Dr Unit 2
- 1355 Goldenrod Dr
- 700 Kathy Ct
- 755 Raintree Dr
- 759 Raintree Dr
- 719 Raintree Dr Unit 1
- 704 Kathy Ct
- 718 Raintree Dr