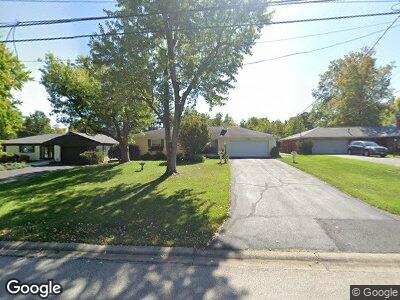
7341 Shewango Way Cincinnati, OH 45243
Estimated Value: $520,026 - $789,000
3
Beds
4
Baths
2,109
Sq Ft
$310/Sq Ft
Est. Value
About This Home
This home is located at 7341 Shewango Way, Cincinnati, OH 45243 and is currently estimated at $654,007, approximately $310 per square foot. 7341 Shewango Way is a home located in Hamilton County with nearby schools including Madeira Elementary School, Madeira Middle School, and Madeira High School.
Ownership History
Date
Name
Owned For
Owner Type
Purchase Details
Closed on
Jul 21, 2009
Sold by
Sweeney Roy O
Bought by
Deacha Rafael J and Deacha Kimberly D
Current Estimated Value
Home Financials for this Owner
Home Financials are based on the most recent Mortgage that was taken out on this home.
Original Mortgage
$245,000
Outstanding Balance
$164,728
Interest Rate
5.43%
Mortgage Type
New Conventional
Estimated Equity
$486,110
Purchase Details
Closed on
Jun 23, 2009
Sold by
King James Arthur and King Judith Crackraft
Bought by
Sweeney Roy O
Home Financials for this Owner
Home Financials are based on the most recent Mortgage that was taken out on this home.
Original Mortgage
$245,000
Outstanding Balance
$164,728
Interest Rate
5.43%
Mortgage Type
New Conventional
Estimated Equity
$486,110
Purchase Details
Closed on
Dec 11, 2003
Sold by
Paternoster Nicholas L and Paternoster Myrtle M
Bought by
King James Arthur and King Judith Cracraft
Create a Home Valuation Report for This Property
The Home Valuation Report is an in-depth analysis detailing your home's value as well as a comparison with similar homes in the area
Home Values in the Area
Average Home Value in this Area
Purchase History
| Date | Buyer | Sale Price | Title Company |
|---|---|---|---|
| Deacha Rafael J | $332,500 | Attorney | |
| Sweeney Roy O | -- | Attorney | |
| King James Arthur | $199,000 | -- |
Source: Public Records
Mortgage History
| Date | Status | Borrower | Loan Amount |
|---|---|---|---|
| Open | Deacha Rafael J | $245,000 | |
| Previous Owner | Paternoster Nicholas L | $145,000 |
Source: Public Records
Tax History Compared to Growth
Tax History
| Year | Tax Paid | Tax Assessment Tax Assessment Total Assessment is a certain percentage of the fair market value that is determined by local assessors to be the total taxable value of land and additions on the property. | Land | Improvement |
|---|---|---|---|---|
| 2024 | $7,181 | $135,482 | $52,724 | $82,758 |
| 2023 | $7,325 | $135,482 | $52,724 | $82,758 |
| 2022 | $7,060 | $108,269 | $39,368 | $68,901 |
| 2021 | $6,896 | $108,269 | $39,368 | $68,901 |
| 2020 | $6,394 | $108,269 | $39,368 | $68,901 |
| 2019 | $6,118 | $96,671 | $35,151 | $61,520 |
| 2018 | $6,168 | $96,671 | $35,151 | $61,520 |
| 2017 | $5,841 | $96,671 | $35,151 | $61,520 |
| 2016 | $6,410 | $99,751 | $16,223 | $83,528 |
| 2015 | $5,936 | $99,751 | $16,223 | $83,528 |
| 2014 | $5,971 | $99,751 | $16,223 | $83,528 |
| 2013 | $6,196 | $99,751 | $16,223 | $83,528 |
Source: Public Records
Map
Nearby Homes
- 7400 S Timberlane Dr
- 7821 Locust Ln
- 7285 Berwood Dr
- 7210 Fowler Ave
- 7906 Dee St
- 7292 E Galbraith Rd
- 7502 Euclid Ave
- 7747 Kugler Mill Rd
- 7288 E Galbraith Rd Unit 28
- 7317 Euclid Ave
- 6640 Kugler Mill Rd
- 7114 Maple Ave
- 7827 Euclid Ave
- 7963 Kugler Mill Rd
- 7247 Iuka Ave
- 6435 Kugler Mill Rd
- 7327 Osceola Dr
- 7021 Wallace Ave
- 7834 Laurel Ave
- 7845 Euclid Ave
- 7341 Shewango Way
- 7351 Shewango Way
- 7331 Shewango Way
- 7361 Shewango Way
- 7321 Shewango Way
- 7340 S Mingo Ln
- 7330 S Mingo Ln
- 7340 Shewango Way
- 7380 S Mingo Ln
- 7320 S Mingo Ln
- 7350 Shewango Way
- 7330 Shewango Way
- 7401 Shewango Way
- 7311 Shewango Way
- 7360 Shewango Way
- 7320 Shewango Way
- 7400 S Mingo Ln
- 7310 S Mingo Ln
- 7411 Shewango Way
- 7400 Shewango Way