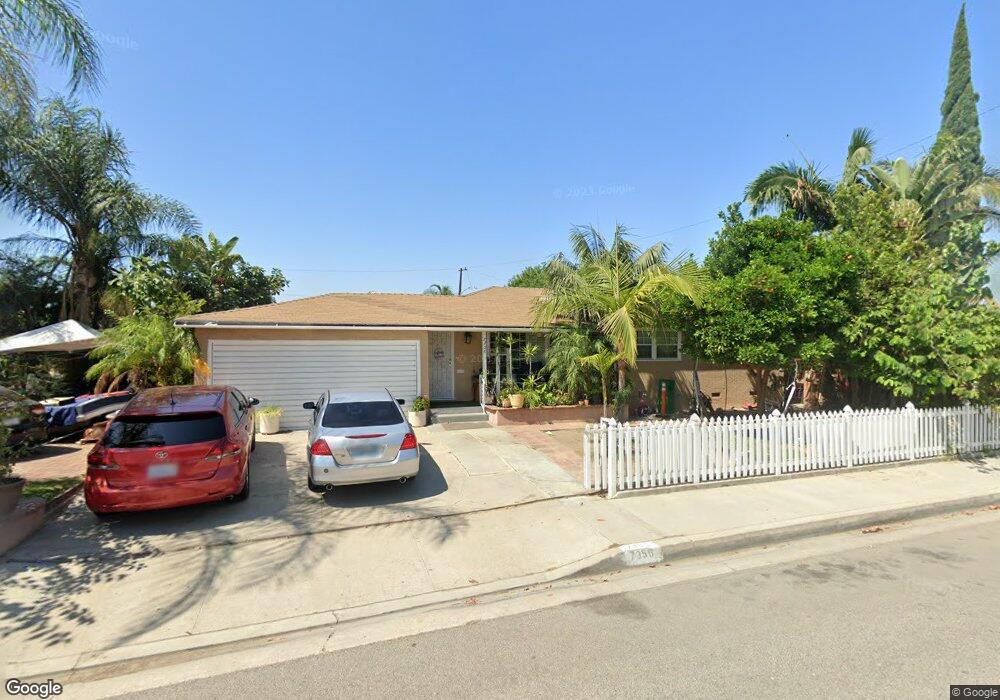
7356 Lugo Ave Paramount, CA 90723
Estimated Value: $663,000 - $743,000
3
Beds
2
Baths
1,182
Sq Ft
$596/Sq Ft
Est. Value
About This Home
This home is located at 7356 Lugo Ave, Paramount, CA 90723 and is currently estimated at $704,690, approximately $596 per square foot. 7356 Lugo Ave is a home located in Los Angeles County with nearby schools including Hollydale School, Alondra Middle School, and Paramount High School.
Ownership History
Date
Name
Owned For
Owner Type
Purchase Details
Closed on
Jul 25, 2019
Sold by
Rosales Ramiro M
Bought by
Rosales Ramiro M and Rosales Maria De Jesus
Current Estimated Value
Purchase Details
Closed on
Dec 10, 2001
Sold by
Rosales Ramiro M
Bought by
Rosales Ramiro M and Rosales Maria Dejesus
Purchase Details
Closed on
Oct 24, 2001
Sold by
Rosales Maria Dejesus and Rosales Ricardo
Bought by
Rosales Ramiro M
Purchase Details
Closed on
Jul 2, 1997
Sold by
Chronister Wilma L and Wilma L Chronister Trust
Bought by
Rosales Ramiro M and Rosales Maria Dejesus
Home Financials for this Owner
Home Financials are based on the most recent Mortgage that was taken out on this home.
Original Mortgage
$133,556
Interest Rate
7.57%
Mortgage Type
FHA
Purchase Details
Closed on
Oct 13, 1995
Sold by
Chronister Wilma L
Bought by
Chronister Wilma L and Wilma L Chrosnister Trust
Create a Home Valuation Report for This Property
The Home Valuation Report is an in-depth analysis detailing your home's value as well as a comparison with similar homes in the area
Home Values in the Area
Average Home Value in this Area
Purchase History
| Date | Buyer | Sale Price | Title Company |
|---|---|---|---|
| Rosales Ramiro M | -- | None Available | |
| Rosales Ramiro M | -- | -- | |
| Rosales Ramiro M | -- | United Title Company | |
| Rosales Ramiro M | $135,000 | American Title Ins Co | |
| Chronister Wilma L | -- | -- |
Source: Public Records
Mortgage History
| Date | Status | Borrower | Loan Amount |
|---|---|---|---|
| Previous Owner | Rosales Ramiro M | $133,556 |
Source: Public Records
Tax History
| Year | Tax Paid | Tax Assessment Tax Assessment Total Assessment is a certain percentage of the fair market value that is determined by local assessors to be the total taxable value of land and additions on the property. | Land | Improvement |
|---|---|---|---|---|
| 2025 | $3,229 | $232,299 | $136,639 | $95,660 |
| 2024 | $3,229 | $227,745 | $133,960 | $93,785 |
| 2023 | $3,170 | $223,281 | $131,334 | $91,947 |
| 2022 | $3,085 | $218,904 | $128,759 | $90,145 |
| 2021 | $3,012 | $214,613 | $126,235 | $88,378 |
| 2019 | $3,075 | $208,249 | $122,492 | $85,757 |
| 2018 | $2,839 | $204,167 | $120,091 | $84,076 |
| 2016 | $2,550 | $196,241 | $115,429 | $80,812 |
| 2015 | $2,411 | $193,295 | $113,696 | $79,599 |
| 2014 | $2,468 | $189,509 | $111,469 | $78,040 |
Source: Public Records
Map
Nearby Homes
- 13636 Garfield Ave
- 13827 Fairlock Ave
- 0 Nevada Ave
- 13919 Arthur Ave Unit 22
- 6100 Mckinley Ave
- 12323 Edgebrook Ave
- 3 Rosecrans Ave
- 11131 Louise Ave
- 6656 Rosecrans Ave Unit N-10
- 13000 Paramount Blvd
- 13108 Brock Ave
- 13450 Merkel Ave
- 11579 Virginia Ave
- 11363 Virginia Ave
- 13438 Obispo Ave
- 13942 Anderson St
- 8217 Howe St
- 8041 Puritan St
- 8139 Priscilla St
- 14134 Orizaba Ave
- 7354 Lugo Ave
- 7346 Lugo Ave
- 7357 Lugo Ave
- 7361 Lugo Ave
- 7348 Cortland Ave
- 7353 Lugo Ave
- 7344 Cortland Ave
- 7354 Cortland Ave
- 7367 Lugo Ave
- 7340 Lugo Ave
- 7340 Cortland Ave
- 7358 Cortland Ave
- 7347 Lugo Ave
- 7334 Cortland Ave
- 7364 Cortland Ave
- 7336 Lugo Ave
- 7341 Lugo Ave
- 7403 Cortland Ave
- 7328 Cortland Ave
- 7402 Cortland Ave
Your Personal Tour Guide
Ask me questions while you tour the home.