7369 Perigord Ct Tujunga, CA 91042
Estimated Value: $1,340,737 - $1,586,000
4
Beds
3
Baths
3,296
Sq Ft
$458/Sq Ft
Est. Value
About This Home
This home is located at 7369 Perigord Ct, Tujunga, CA 91042 and is currently estimated at $1,510,434, approximately $458 per square foot. 7369 Perigord Ct is a home located in Los Angeles County with nearby schools including Mt. Gleason Middle School, Verdugo Hills Senior High School, and Plainview Academic Charter Academy.
Ownership History
Date
Name
Owned For
Owner Type
Purchase Details
Closed on
Jan 29, 2016
Sold by
Kim Yoon Dong
Bought by
The 2016 Kim Family Trust
Current Estimated Value
Purchase Details
Closed on
May 25, 2001
Sold by
Renaissance Tujunga Lp
Bought by
Kim Yoon Dong
Home Financials for this Owner
Home Financials are based on the most recent Mortgage that was taken out on this home.
Original Mortgage
$250,000
Interest Rate
7.14%
Create a Home Valuation Report for This Property
The Home Valuation Report is an in-depth analysis detailing your home's value as well as a comparison with similar homes in the area
Home Values in the Area
Average Home Value in this Area
Purchase History
| Date | Buyer | Sale Price | Title Company |
|---|---|---|---|
| The 2016 Kim Family Trust | -- | None Available | |
| Kim Yoon Dong | $440,000 | Orange Coast Title |
Source: Public Records
Mortgage History
| Date | Status | Borrower | Loan Amount |
|---|---|---|---|
| Closed | Kim Yoon Dong | $250,000 |
Source: Public Records
Tax History
| Year | Tax Paid | Tax Assessment Tax Assessment Total Assessment is a certain percentage of the fair market value that is determined by local assessors to be the total taxable value of land and additions on the property. | Land | Improvement |
|---|---|---|---|---|
| 2025 | $8,216 | $662,992 | $282,373 | $380,619 |
| 2024 | $8,216 | $649,993 | $276,837 | $373,156 |
| 2023 | $8,062 | $637,249 | $271,409 | $365,840 |
| 2022 | $7,695 | $624,755 | $266,088 | $358,667 |
| 2021 | $7,586 | $612,506 | $260,871 | $351,635 |
| 2019 | $7,362 | $594,341 | $253,135 | $341,206 |
| 2018 | $7,217 | $582,688 | $248,172 | $334,516 |
| 2016 | $6,870 | $560,063 | $238,536 | $321,527 |
| 2015 | $6,770 | $551,651 | $234,953 | $316,698 |
| 2014 | $6,798 | $540,846 | $230,351 | $310,495 |
Source: Public Records
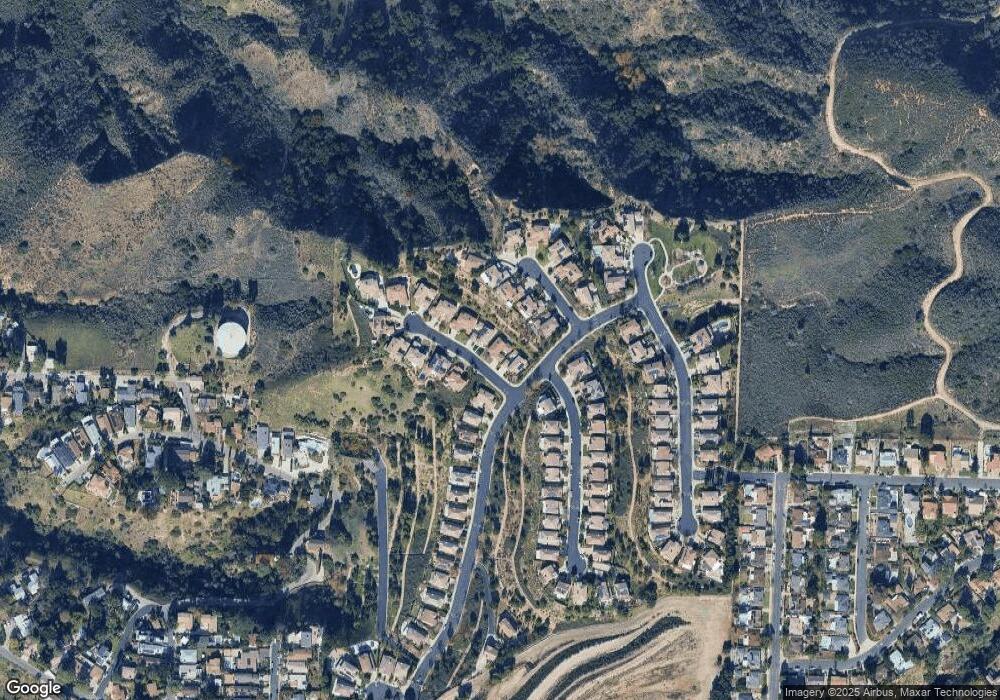
Map
Nearby Homes
- 11071 N Tamberly Ln
- 7628 Airlie Dr
- 11060 Plainview Ave
- 11064 Plainview Ave
- 7125 Lonzo St
- 7335 Kyle St
- 7291 Chetwood Dr
- 7815 Denivelle Rd
- 10743 Mountair Ave
- 10918 Mount Gleason Ave
- 10834 Sevenhills Dr
- 10710 Helendale Ave
- 7755 Forsythe St
- 11020 Whitegate Ave
- 7867 Rim Canyon Rd
- 10626 Mountair Ave
- 11014 Leolang Ave
- 7848 Forsythe St
- 7853 Jayseel St
- 10600 Helen Ave
- 7373 Perigord Ct
- 7365 Perigord Ct
- 7377 Perigord Ct
- 11117 Renaissance Dr
- 7352 Chantilly Ln
- 7346 Chantilly Ln
- 7374 Perigord Ct
- 7358 Chantilly Ln
- 11121 Tamberly Ln
- 7364 Chantilly Ln
- 7381 Perigord Ct
- 7378 Perigord Ct
- 11109 Renaissance Dr
- 11124 Tamberly Ln
- 11109 Tamberly Ln
- 7382 Perigord Ct
- 11103 Renaissance Dr
- 11155 Renaissance Dr
- 7385 Perigord Ct
- 7370 Chantilly Ln
Your Personal Tour Guide
Ask me questions while you tour the home.