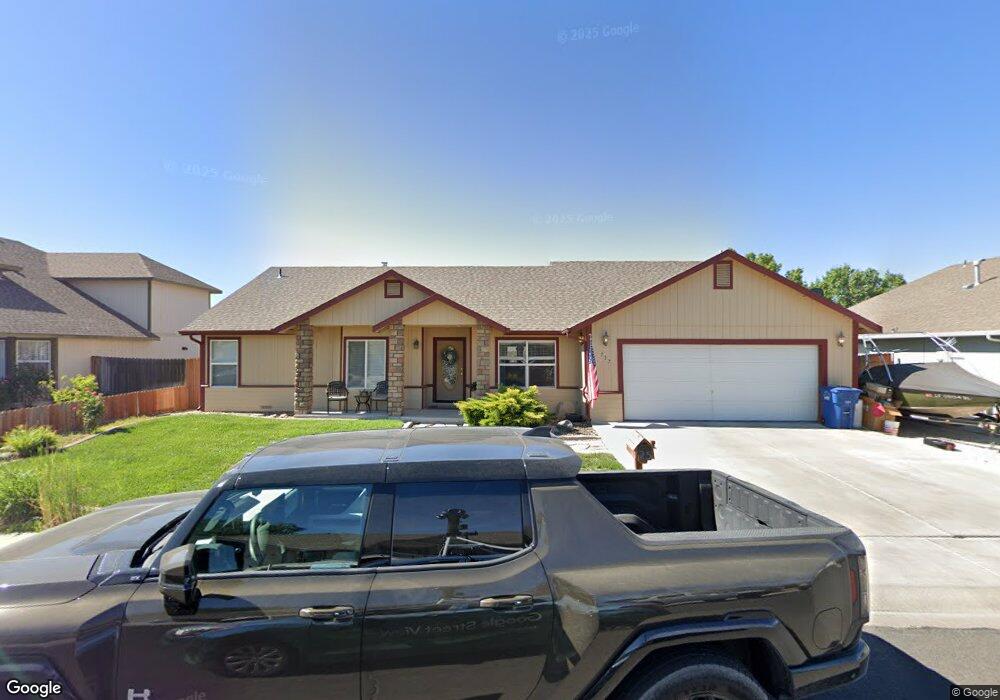
737 Dani St Fallon, NV 89406
Estimated Value: $406,518 - $454,000
4
Beds
2
Baths
1,836
Sq Ft
$229/Sq Ft
Est. Value
About This Home
This home is located at 737 Dani St, Fallon, NV 89406 and is currently estimated at $420,380, approximately $228 per square foot. 737 Dani St is a home located in Churchill County with nearby schools including Lahontan Elementary School, E.C. Best Elementary School, and Numa Elementary School.
Ownership History
Date
Name
Owned For
Owner Type
Purchase Details
Closed on
Oct 13, 2010
Sold by
Troxel Michelle
Bought by
Troxel Ryan B
Current Estimated Value
Purchase Details
Closed on
Oct 6, 2010
Sold by
Fannie Mae
Bought by
Troxel Gary L and Troxel Cynthia E
Purchase Details
Closed on
Mar 30, 2010
Sold by
Dolan Bradley J and Dolan Julie A
Bought by
Federal National Mortgage Association
Create a Home Valuation Report for This Property
The Home Valuation Report is an in-depth analysis detailing your home's value as well as a comparison with similar homes in the area
Home Values in the Area
Average Home Value in this Area
Purchase History
| Date | Buyer | Sale Price | Title Company |
|---|---|---|---|
| Troxel Ryan B | -- | Northern Nevada Title Cc | |
| Troxel Gary L | $131,250 | Northern Nevada Title Cc | |
| Federal National Mortgage Association | $258,217 | First American National Defa |
Source: Public Records
Tax History
| Year | Tax Paid | Tax Assessment Tax Assessment Total Assessment is a certain percentage of the fair market value that is determined by local assessors to be the total taxable value of land and additions on the property. | Land | Improvement |
|---|---|---|---|---|
| 2025 | $2,897 | $100,618 | $21,700 | $78,918 |
| 2024 | $2,897 | $99,358 | $19,950 | $79,408 |
| 2023 | $2,897 | $94,399 | $19,950 | $74,449 |
| 2022 | $2,482 | $76,373 | $11,900 | $64,473 |
| 2021 | $2,296 | $74,282 | $11,900 | $62,382 |
| 2020 | $2,211 | $68,813 | $11,900 | $56,913 |
| 2019 | $2,147 | $67,310 | $11,900 | $55,410 |
| 2018 | $2,049 | $65,897 | $11,900 | $53,997 |
| 2017 | $1,967 | $64,456 | $10,500 | $53,956 |
| 2016 | $1,917 | $57,299 | $7,875 | $49,424 |
| 2015 | $1,880 | $51,677 | $7,875 | $43,802 |
| 2014 | $1,830 | $47,626 | $7,875 | $39,751 |
Source: Public Records
Map
Nearby Homes
- 641 Megan Way
- 775 Karry Way
- 530 Michael Dr
- 806 Karry Way
- 285 Amanda Ln
- 1141 Alder Dr
- 119 Toiyabe Ln
- 800 Great Basin Ln
- 815 Great Basin Ln
- 882 Great Basin Ln
- 1755 Coleman Rd
- 215 Hunter Park Way
- 681 Keppel St
- 621 Keppel St
- 120 Hunter Park Way
- 728 Keppel St
- 618 Keppel St
- 604 Keppel St
- 90 S Allen St
- 343 Crystal Ct
- 719 Dani St
- 654 Keddie St
- 678 Keddie St
- 628 Keddie St
- 704 Keddie St Unit 1
- 704 Keddie St
- 701 Dani St
- 771 Dani St
- 734 Dani St
- 758 Dani St
- 602 Keddie St
- 712 Dani St
- 736 Keddie St
- 628 Dani St
- 653 Dani St
- 584 Keddie St
- 772 Keddie St
- 0 Keddie St Unit 150001422
- 0 Keddie St Unit 190009864
- 0 Keddie St Unit 150001421
Your Personal Tour Guide
Ask me questions while you tour the home.