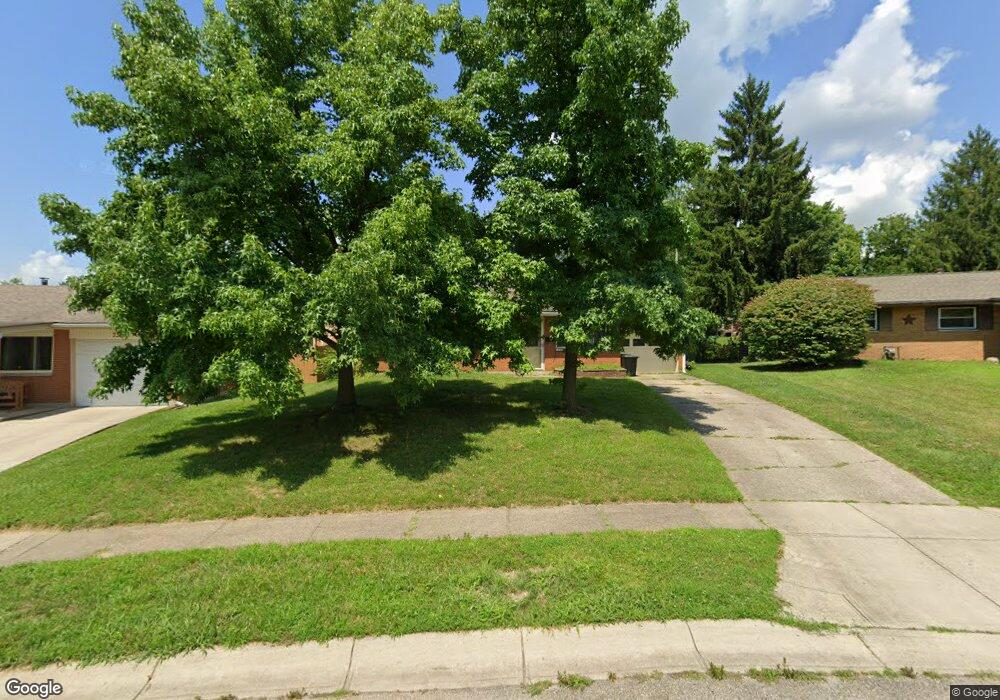
737 Loop St Miamisburg, OH 45342
Downtown Miamisburg NeighborhoodEstimated Value: $180,341 - $192,000
3
Beds
1
Bath
1,015
Sq Ft
$183/Sq Ft
Est. Value
About This Home
This home is located at 737 Loop St, Miamisburg, OH 45342 and is currently estimated at $185,335, approximately $182 per square foot. 737 Loop St is a home located in Montgomery County with nearby schools including Miamisburg High School and Bethel Baptist School.
Ownership History
Date
Name
Owned For
Owner Type
Purchase Details
Closed on
Sep 26, 2011
Sold by
Townley Patricia A
Bought by
Cull Carol S and Cull Brenda K
Current Estimated Value
Home Financials for this Owner
Home Financials are based on the most recent Mortgage that was taken out on this home.
Original Mortgage
$50,000
Outstanding Balance
$34,168
Interest Rate
4.14%
Mortgage Type
Future Advance Clause Open End Mortgage
Estimated Equity
$151,167
Purchase Details
Closed on
Aug 15, 2006
Sold by
Collins Thomas and Collins Sharon K
Bought by
Townley Patricia A
Home Financials for this Owner
Home Financials are based on the most recent Mortgage that was taken out on this home.
Original Mortgage
$41,000
Interest Rate
6.88%
Mortgage Type
Purchase Money Mortgage
Purchase Details
Closed on
Jun 18, 1998
Sold by
Thomas Collins
Bought by
Collins Thomas and Collins Sharon K
Purchase Details
Closed on
Jun 28, 1996
Sold by
Hill Ronald R
Bought by
Collins Thomas
Create a Home Valuation Report for This Property
The Home Valuation Report is an in-depth analysis detailing your home's value as well as a comparison with similar homes in the area
Home Values in the Area
Average Home Value in this Area
Purchase History
| Date | Buyer | Sale Price | Title Company |
|---|---|---|---|
| Cull Carol S | $50,000 | Attorney | |
| Townley Patricia A | $111,000 | None Available | |
| Collins Thomas | -- | -- | |
| Collins Thomas | -- | -- | |
| Collins Thomas | $76,500 | -- |
Source: Public Records
Mortgage History
| Date | Status | Borrower | Loan Amount |
|---|---|---|---|
| Open | Cull Carol S | $50,000 | |
| Closed | Townley Patricia A | $41,000 |
Source: Public Records
Tax History Compared to Growth
Tax History
| Year | Tax Paid | Tax Assessment Tax Assessment Total Assessment is a certain percentage of the fair market value that is determined by local assessors to be the total taxable value of land and additions on the property. | Land | Improvement |
|---|---|---|---|---|
| 2024 | $3,073 | $47,200 | $10,430 | $36,770 |
| 2023 | $3,073 | $47,200 | $10,430 | $36,770 |
| 2022 | $2,450 | $31,680 | $7,000 | $24,680 |
| 2021 | $2,176 | $31,680 | $7,000 | $24,680 |
| 2020 | $2,171 | $31,680 | $7,000 | $24,680 |
| 2019 | $1,688 | $22,540 | $9,800 | $12,740 |
| 2018 | $1,694 | $22,540 | $9,800 | $12,740 |
| 2017 | $1,683 | $22,540 | $9,800 | $12,740 |
| 2016 | $1,490 | $19,190 | $9,800 | $9,390 |
| 2015 | $1,462 | $19,190 | $9,800 | $9,390 |
| 2014 | $1,462 | $19,190 | $9,800 | $9,390 |
| 2012 | -- | $17,550 | $9,800 | $7,750 |
Source: Public Records
Map
Nearby Homes
- 747 Loop St
- 1121 Dayket Cir
- 630 N 11th St
- 948 Kercher St
- 1232 Hollyhill Dr
- 1137 E Pearl St
- 1109 Sundance Dr
- 1026 Esther Ave
- 857 Lea Castle Place
- 1642 Carolyn Dr
- 555 E Sycamore St
- 1678 Carolyn Dr
- 740 E Central Ave
- 24 S 8th St
- 1616 Hickory Glenn Dr
- 1025 Lord Fitzwalter Dr
- 607 E Central Ave
- 736 Park Ave
- 703 Friar Tuck Ct
- 233 Woodridge Dr