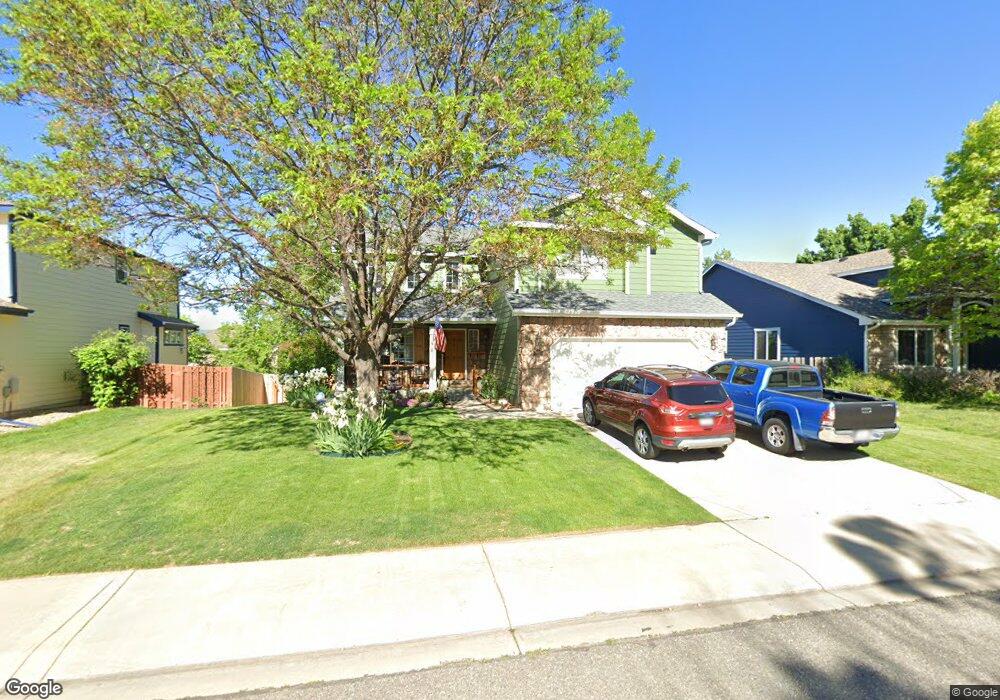
737 Zachary Ct Longmont, CO 80504
Kensington NeighborhoodEstimated Value: $566,000 - $647,000
4
Beds
3
Baths
1,937
Sq Ft
$311/Sq Ft
Est. Value
About This Home
This home is located at 737 Zachary Ct, Longmont, CO 80504 and is currently estimated at $601,559, approximately $310 per square foot. 737 Zachary Ct is a home located in Boulder County with nearby schools including Rocky Mountain Elementary School, Trail Ridge Middle School, and Skyline High School.
Ownership History
Date
Name
Owned For
Owner Type
Purchase Details
Closed on
Nov 10, 2014
Sold by
Rollings Paul Andrew
Bought by
Rollings Paul Andrew
Current Estimated Value
Purchase Details
Closed on
Jun 28, 2005
Sold by
Johnson Monty and Leier Lezlie
Bought by
Rollings Paul Andrew
Home Financials for this Owner
Home Financials are based on the most recent Mortgage that was taken out on this home.
Original Mortgage
$283,100
Outstanding Balance
$162,982
Interest Rate
7.29%
Mortgage Type
Purchase Money Mortgage
Estimated Equity
$438,577
Purchase Details
Closed on
Oct 14, 2002
Sold by
Johnson Monty W and Leier Lezlie
Bought by
Johnson Monty
Home Financials for this Owner
Home Financials are based on the most recent Mortgage that was taken out on this home.
Original Mortgage
$246,801
Interest Rate
4.62%
Purchase Details
Closed on
Jan 24, 2000
Sold by
Woodcrest Homes Inc
Bought by
Johnson Monty W
Home Financials for this Owner
Home Financials are based on the most recent Mortgage that was taken out on this home.
Original Mortgage
$200,000
Interest Rate
7.62%
Create a Home Valuation Report for This Property
The Home Valuation Report is an in-depth analysis detailing your home's value as well as a comparison with similar homes in the area
Home Values in the Area
Average Home Value in this Area
Purchase History
| Date | Buyer | Sale Price | Title Company |
|---|---|---|---|
| Rollings Paul Andrew | -- | None Available | |
| Rollings Paul Andrew | $298,000 | -- | |
| Johnson Monty | -- | Land Title Guarantee Company | |
| Johnson Monty W | $227,979 | Land Title |
Source: Public Records
Mortgage History
| Date | Status | Borrower | Loan Amount |
|---|---|---|---|
| Open | Rollings Paul Andrew | $283,100 | |
| Previous Owner | Johnson Monty | $246,801 | |
| Previous Owner | Johnson Monty W | $200,000 |
Source: Public Records
Tax History Compared to Growth
Tax History
| Year | Tax Paid | Tax Assessment Tax Assessment Total Assessment is a certain percentage of the fair market value that is determined by local assessors to be the total taxable value of land and additions on the property. | Land | Improvement |
|---|---|---|---|---|
| 2025 | $3,635 | $38,388 | $9,988 | $28,400 |
| 2024 | $3,635 | $38,388 | $9,988 | $28,400 |
| 2023 | $3,586 | $38,002 | $10,955 | $30,733 |
| 2022 | $3,156 | $31,894 | $7,715 | $24,179 |
| 2021 | $3,197 | $32,812 | $7,937 | $24,875 |
| 2020 | $2,910 | $29,959 | $6,936 | $23,023 |
| 2019 | $2,864 | $29,959 | $6,936 | $23,023 |
| 2018 | $2,602 | $27,396 | $5,184 | $22,212 |
| 2017 | $2,567 | $30,288 | $5,731 | $24,557 |
| 2016 | $2,423 | $25,344 | $7,482 | $17,862 |
| 2015 | $2,309 | $20,999 | $4,617 | $16,382 |
| 2014 | $1,961 | $20,999 | $4,617 | $16,382 |
Source: Public Records
Map
Nearby Homes
- 742 Megan Ct
- 756 Brookside Dr
- 902 Sugar Mill Ave
- 908 Sugar Mill Ave
- 712 Pendleton Ave
- 811 Brookside Dr
- 713 Pendleton Ave
- 575 Brookside Dr
- 618 Silver Star Ct
- 741 Elliott St
- 1267 E 9th Ave
- 946 Granite Ct
- 12027 Saint Vrain Rd
- 1245 Trail Ridge Rd
- 448 Morgan Rd
- 829 Hubbard Dr
- 620 Independence Dr
- 5004 Fox Hill Dr
- 262 E 5th Ave
- 225 E 8th Ave Unit E20