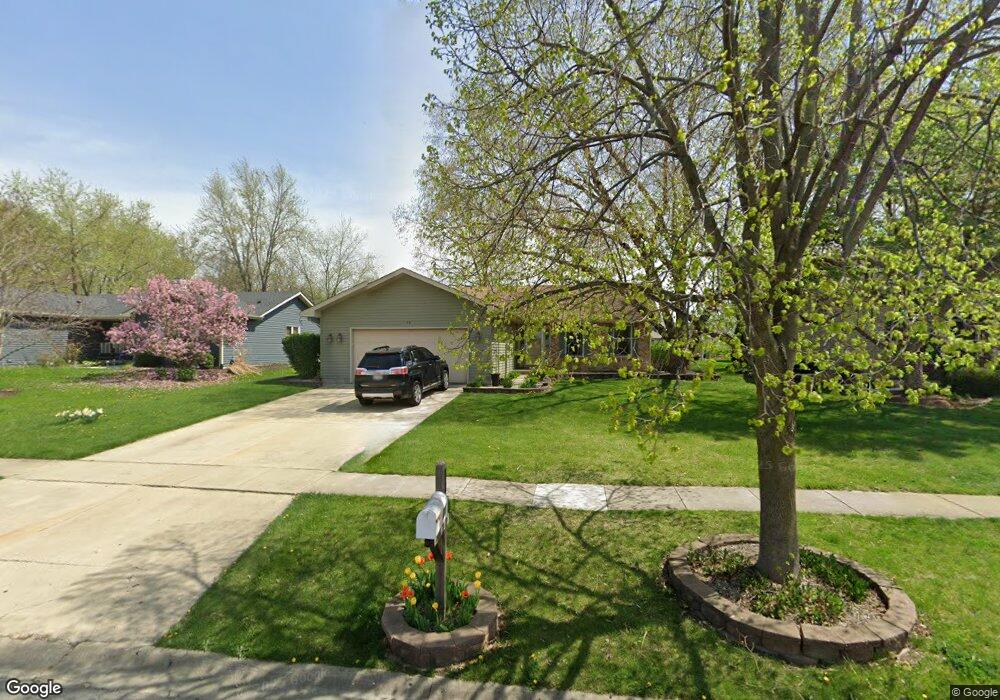
74 Brock Way Unit 30 Oswego, IL 60543
Boulder Hill NeighborhoodEstimated Value: $320,000 - $357,690
3
Beds
3
Baths
1,584
Sq Ft
$214/Sq Ft
Est. Value
About This Home
This home is located at 74 Brock Way Unit 30, Oswego, IL 60543 and is currently estimated at $339,673, approximately $214 per square foot. 74 Brock Way Unit 30 is a home located in Kendall County with nearby schools including Old Post Elementary School, Thompson Jr. High School, and Oswego High School.
Ownership History
Date
Name
Owned For
Owner Type
Purchase Details
Closed on
Apr 27, 2011
Sold by
Fannie Mae
Bought by
Boyle Amanda
Current Estimated Value
Home Financials for this Owner
Home Financials are based on the most recent Mortgage that was taken out on this home.
Original Mortgage
$140,711
Outstanding Balance
$97,472
Interest Rate
4.81%
Mortgage Type
FHA
Estimated Equity
$242,201
Purchase Details
Closed on
Oct 20, 2010
Sold by
Cook John D and Cook Kelly E
Bought by
Federal National Mortgage Association
Purchase Details
Closed on
Mar 6, 2002
Sold by
Madigan Linda J
Bought by
Cook John D and Cook Kelly E
Home Financials for this Owner
Home Financials are based on the most recent Mortgage that was taken out on this home.
Original Mortgage
$110,000
Interest Rate
7.03%
Purchase Details
Closed on
Jan 1, 1993
Bought by
Madigan Linda J
Purchase Details
Closed on
Sep 1, 1987
Purchase Details
Closed on
Nov 1, 1985
Create a Home Valuation Report for This Property
The Home Valuation Report is an in-depth analysis detailing your home's value as well as a comparison with similar homes in the area
Home Values in the Area
Average Home Value in this Area
Purchase History
| Date | Buyer | Sale Price | Title Company |
|---|---|---|---|
| Boyle Amanda | $147,000 | Greater Illinois Title Co | |
| Federal National Mortgage Association | -- | None Available | |
| Cook John D | $176,500 | -- | |
| Madigan Linda J | $160,000 | -- | |
| -- | $14,000 | -- | |
| -- | $35,000 | -- |
Source: Public Records
Mortgage History
| Date | Status | Borrower | Loan Amount |
|---|---|---|---|
| Open | Boyle Amanda | $140,711 | |
| Previous Owner | Cook John D | $110,000 | |
| Closed | Madigan Linda J | -- |
Source: Public Records
Tax History Compared to Growth
Tax History
| Year | Tax Paid | Tax Assessment Tax Assessment Total Assessment is a certain percentage of the fair market value that is determined by local assessors to be the total taxable value of land and additions on the property. | Land | Improvement |
|---|---|---|---|---|
| 2024 | $7,601 | $100,450 | $21,511 | $78,939 |
| 2023 | $7,689 | $97,524 | $20,884 | $76,640 |
| 2022 | $7,689 | $91,144 | $19,518 | $71,626 |
| 2021 | $7,409 | $85,181 | $18,241 | $66,940 |
| 2020 | $7,172 | $81,904 | $17,539 | $64,365 |
| 2019 | $7,286 | $81,904 | $17,539 | $64,365 |
| 2018 | $6,659 | $74,737 | $16,004 | $58,733 |
| 2017 | $6,446 | $68,882 | $14,750 | $54,132 |
| 2016 | $5,949 | $63,194 | $13,532 | $49,662 |
| 2015 | $5,728 | $58,513 | $12,530 | $45,983 |
| 2014 | -- | $56,262 | $12,048 | $44,214 |
| 2013 | -- | $59,223 | $12,682 | $46,541 |
Source: Public Records
Map
Nearby Homes
- 22 Sherwick Rd
- 38 Ashlawn Ave
- 9 Cebold Dr
- 4 Circle Ct
- 3 Orchard Rd
- 123 Orchard Rd
- 2 Orchard Rd
- 10 Crofton Rd
- 40 Codorus Rd
- 47 Old Post Rd
- 141 River Mist Dr
- 156 River Mist Dr
- 1415 State Route 31
- 2110 State Route 31
- 39 Cayman Dr
- 420 Chesterfield Ct Unit 420
- 2300 Light Rd Unit 209
- 3 Scarsdale Rd
- 7.43 Acres Vacant La State Route 31
- 2600 Light Rd Unit 210