Estimated Value: $456,941 - $717,000
3
Beds
2
Baths
1,196
Sq Ft
$484/Sq Ft
Est. Value
About This Home
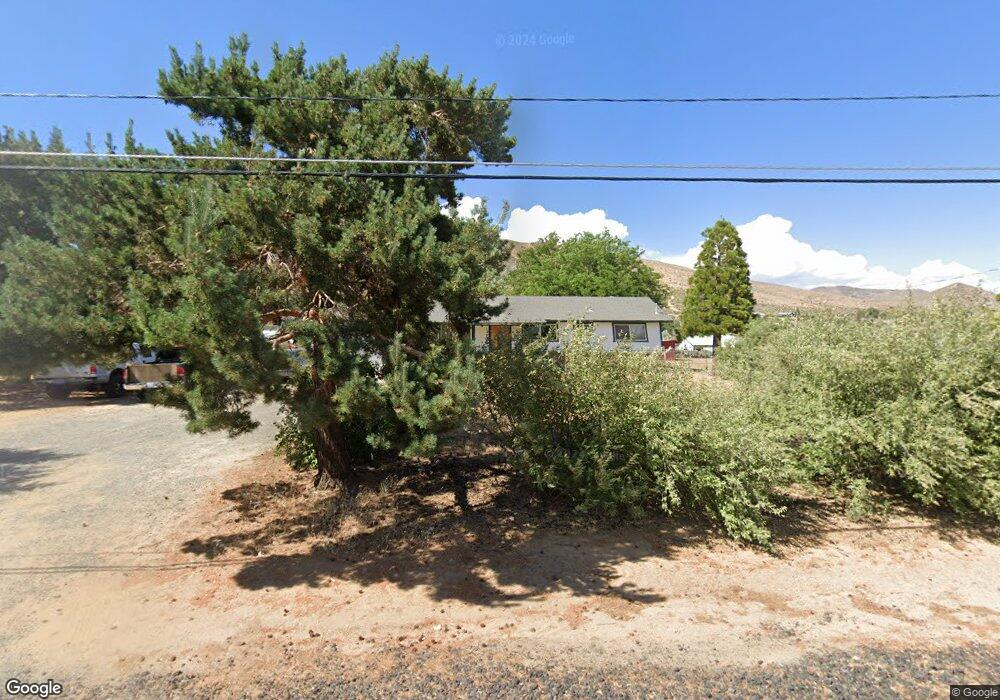
This home is located at 74 Ruby Ln, Carson City, NV 89706 and is currently estimated at $578,735, approximately $483 per square foot. 74 Ruby Ln is a home located in Carson City with nearby schools including Edith W. Fritch Elementary School, Carson Middle School, and Carson High School.
Ownership History
Date
Name
Owned For
Owner Type
Purchase Details
Closed on
Mar 11, 2026
Sold by
Foley Dennis and Foley Roline J
Bought by
Foley Family Trust and Foley
Current Estimated Value
Purchase Details
Closed on
Jan 9, 2017
Sold by
Foley Dennis and Foley Brandon
Bought by
Foley Dennis D and Foley Roline
Home Financials for this Owner
Home Financials are based on the most recent Mortgage that was taken out on this home.
Original Mortgage
$278,400
Interest Rate
4.16%
Mortgage Type
VA
Purchase Details
Closed on
Feb 17, 2015
Sold by
Foley Stephen J and Foley Brenda S
Bought by
Foley Stephen J
Home Financials for this Owner
Home Financials are based on the most recent Mortgage that was taken out on this home.
Original Mortgage
$185,000
Interest Rate
3.66%
Mortgage Type
New Conventional
Create a Home Valuation Report for This Property
The Home Valuation Report is an in-depth analysis detailing your home's value as well as a comparison with similar homes in the area
Home Values in the Area
Average Home Value in this Area
Purchase History
| Date | Buyer | Sale Price | Title Company |
|---|---|---|---|
| Foley Family Trust | -- | None Listed On Document | |
| Foley Dennis D | $325,000 | Western Title Company Inc | |
| Foley Stephen J | -- | First Centennial Reno |
Source: Public Records
Mortgage History
| Date | Status | Borrower | Loan Amount |
|---|---|---|---|
| Previous Owner | Foley Dennis D | $278,400 | |
| Previous Owner | Foley Stephen J | $185,000 |
Source: Public Records
Tax History
| Year | Tax Paid | Tax Assessment Tax Assessment Total Assessment is a certain percentage of the fair market value that is determined by local assessors to be the total taxable value of land and additions on the property. | Land | Improvement |
|---|---|---|---|---|
| 2025 | $2,504 | $91,530 | $42,000 | $49,530 |
| 2024 | $2,432 | $92,171 | $42,000 | $50,171 |
| 2023 | $2,361 | $87,879 | $42,000 | $45,879 |
| 2022 | $2,293 | $77,093 | $36,750 | $40,343 |
| 2021 | $2,123 | $67,680 | $32,900 | $34,780 |
| 2019 | $2,000 | $65,665 | $29,050 | $36,615 |
| 2018 | $1,908 | $63,320 | $26,425 | $36,895 |
| 2017 | $1,852 | $62,987 | $25,200 | $37,787 |
| 2016 | $1,806 | $60,152 | $21,000 | $39,152 |
| 2015 | $1,802 | $59,003 | $21,525 | $37,478 |
| 2014 | $1,750 | $54,069 | $17,938 | $36,131 |
Source: Public Records
Map
Nearby Homes
- 178 Lisa Way
- 5049 Imus Rd
- 39 Granite Way
- 31 Castle Way
- 6 Castle Way
- 504 Sandstone Dr
- 1775 Vineyard Way
- 208 E Hampton Dr
- 3200 Pine Ln
- 1350 Old Hot Springs Rd
- 812 Chernus Dr
- 1608 Evergreen Dr
- 2553 Chardonnay Dr
- 2495 Taylor Way
- 2296 Oak Ridge Dr
- 2632 New Ridge Dr
- 2560 Snowflake Dr
- 2511 Simons Ct
- 1310 Shadowridge Dr
- 613 Ivy St
Your Personal Tour Guide
Ask me questions while you tour the home.