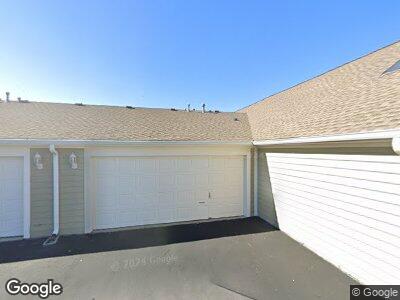
7415 Chapel Villas-C Dr Unit B-10/U-C Indianapolis, IN 46214
Chapel Hill-Ben Davis NeighborhoodEstimated Value: $197,233 - $225,000
2
Beds
2
Baths
1,310
Sq Ft
$160/Sq Ft
Est. Value
About This Home
This home is located at 7415 Chapel Villas-C Dr Unit B-10/U-C, Indianapolis, IN 46214 and is currently estimated at $210,058, approximately $160 per square foot. 7415 Chapel Villas-C Dr Unit B-10/U-C is a home located in Marion County with nearby schools including Westlake Elementary School, Chapel Hill 7th & 8th Grade Center, and Ben Davis Ninth Grade Center.
Ownership History
Date
Name
Owned For
Owner Type
Purchase Details
Closed on
Oct 23, 2019
Sold by
West Willard S and West Lois
Bought by
West Lois L
Current Estimated Value
Purchase Details
Closed on
Sep 5, 2017
Sold by
Thompson Rick
Bought by
West Willard S and West Lois
Purchase Details
Closed on
Mar 11, 2016
Sold by
Baker Helen E
Bought by
Thompson Rick
Home Financials for this Owner
Home Financials are based on the most recent Mortgage that was taken out on this home.
Original Mortgage
$85,600
Interest Rate
3.65%
Mortgage Type
New Conventional
Purchase Details
Closed on
Jul 27, 2007
Sold by
Thomas Dennis A
Bought by
Baker Helen E
Home Financials for this Owner
Home Financials are based on the most recent Mortgage that was taken out on this home.
Original Mortgage
$41,000
Interest Rate
6.69%
Mortgage Type
New Conventional
Create a Home Valuation Report for This Property
The Home Valuation Report is an in-depth analysis detailing your home's value as well as a comparison with similar homes in the area
Home Values in the Area
Average Home Value in this Area
Purchase History
| Date | Buyer | Sale Price | Title Company |
|---|---|---|---|
| West Lois L | -- | None Available | |
| West Willard S | $117,000 | -- | |
| West Willard S | $117,000 | Chicago Title | |
| Thompson Rick | -- | Stewart Title Company | |
| Baker Helen E | -- | None Available |
Source: Public Records
Mortgage History
| Date | Status | Borrower | Loan Amount |
|---|---|---|---|
| Previous Owner | Thompson Rick | $85,600 | |
| Previous Owner | Baker Helen E | $41,000 |
Source: Public Records
Tax History Compared to Growth
Tax History
| Year | Tax Paid | Tax Assessment Tax Assessment Total Assessment is a certain percentage of the fair market value that is determined by local assessors to be the total taxable value of land and additions on the property. | Land | Improvement |
|---|---|---|---|---|
| 2024 | $1,981 | $192,200 | $21,300 | $170,900 |
| 2023 | $1,981 | $164,800 | $21,300 | $143,500 |
| 2022 | $1,948 | $160,000 | $21,300 | $138,700 |
| 2021 | $1,777 | $130,400 | $21,300 | $109,100 |
| 2020 | $1,669 | $123,100 | $21,300 | $101,800 |
| 2019 | $1,703 | $125,600 | $21,300 | $104,300 |
| 2018 | $1,382 | $114,500 | $21,300 | $93,200 |
| 2017 | $1,274 | $106,700 | $21,300 | $85,400 |
| 2016 | $1,190 | $100,000 | $21,300 | $78,700 |
| 2014 | $2,060 | $103,000 | $21,300 | $81,700 |
| 2013 | $2,060 | $103,000 | $21,300 | $81,700 |
Source: Public Records
Map
Nearby Homes
- 7415 Chapel Villas Dr Unit D
- 218 Demarest Dr
- 7506 Radburn Cir
- 7629 Walton Dr
- 1 Lenora Ave
- 1139 Topp Creek Dr
- 7010 Beargrass Ct
- 6953 Beargrass Ct
- 320 Red Tail Ln
- 7128 Moon Ct
- 411 Red Tail Ln
- 7444 Mount Herman Ave
- 7425 Mount Herman Ave
- 915 Prestwick Dr Unit D
- 7119 Topp Creek Ct
- 609 Delray Dr
- 6707 Greendale Ln
- 6847 W 15th St
- 647 Mulford Ct
- 617 Kokomo Ln
- 7415 Chapel Villas-C Dr Unit B-10/U-C
- 7415 Chapel Villas-D Dr W
- 7415 Chapel Villas Dr Unit B-10/U-C
- 7415 Chapel Villas Dr Unit B
- 7415 Chapel Villas Dr Unit C
- 7415 Chapel Villas Dr
- 7415 Chapel Villas Dr Unit D
- 7415 Chapel Villas-B Dr
- 7415 Chapel Villas-D Dr
- 7415 Chapel Villas-D Dr Unit 10
- 7415 Chapel Villas-D Dr Unit 10
- 7325 Chapel Villas Dr
- 7325 Chapel Villas Dr Unit BLD 8
- 7346 Chapel Villas Dr Unit D
- 7346 Chapel Villas Dr Unit D
- 7346 Chapel Villas Dr Unit C
- 7346 Chapel Villas Dr Unit B
- 7346 Chapel Villas Dr Unit A
- 7346 Chapel Villas - Unit D Ln Unit D
- 7416 Chapel Villas Dr Unit B