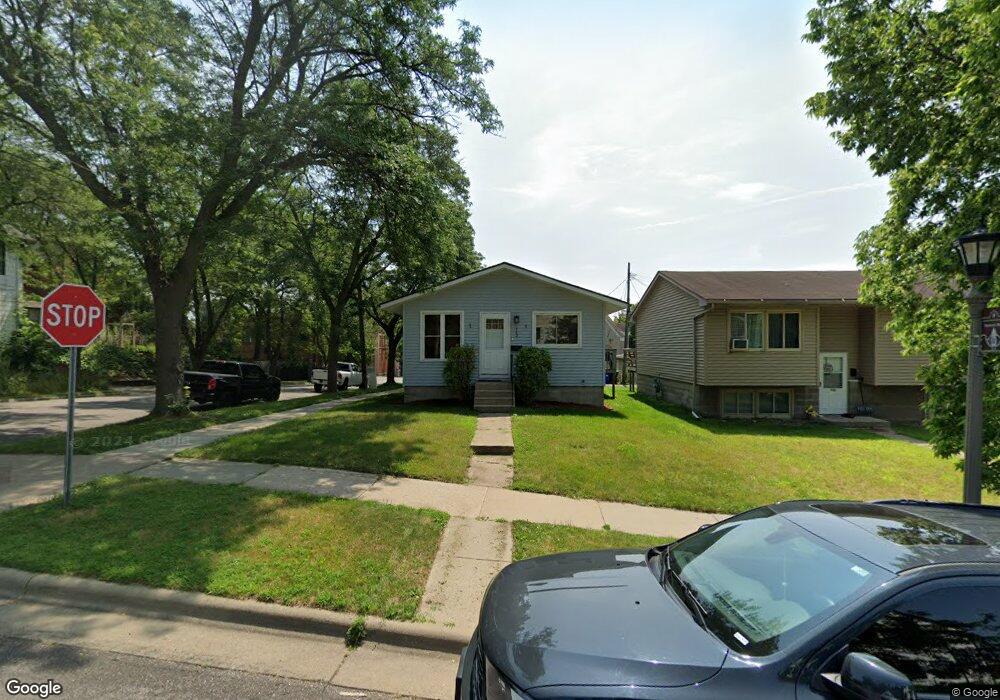
742 4th St E Saint Paul, MN 55106
Dayton's Bluff NeighborhoodEstimated Value: $253,000 - $273,000
3
Beds
2
Baths
968
Sq Ft
$270/Sq Ft
Est. Value
About This Home
This home is located at 742 4th St E, Saint Paul, MN 55106 and is currently estimated at $261,523, approximately $270 per square foot. 742 4th St E is a home located in Ramsey County with nearby schools including Dayton's Bluff Achievement Plus Elementary School, Battle Creek Middle School, and Harding Senior High School.
Ownership History
Date
Name
Owned For
Owner Type
Purchase Details
Closed on
Nov 4, 2016
Sold by
Minnesota Development Group Llc
Bought by
Williams Shanice
Current Estimated Value
Home Financials for this Owner
Home Financials are based on the most recent Mortgage that was taken out on this home.
Original Mortgage
$139,092
Outstanding Balance
$111,667
Interest Rate
3.42%
Mortgage Type
FHA
Estimated Equity
$149,856
Purchase Details
Closed on
Nov 6, 2015
Sold by
Tedesco Albert R and Tedesco Rae Carol
Bought by
Minnesota Development Group Llc
Create a Home Valuation Report for This Property
The Home Valuation Report is an in-depth analysis detailing your home's value as well as a comparison with similar homes in the area
Home Values in the Area
Average Home Value in this Area
Purchase History
| Date | Buyer | Sale Price | Title Company |
|---|---|---|---|
| Williams Shanice | $159,000 | West Title Llc | |
| Minnesota Development Group Llc | $52,600 | West Title Llc |
Source: Public Records
Mortgage History
| Date | Status | Borrower | Loan Amount |
|---|---|---|---|
| Open | Williams Shanice | $139,092 |
Source: Public Records
Tax History
| Year | Tax Paid | Tax Assessment Tax Assessment Total Assessment is a certain percentage of the fair market value that is determined by local assessors to be the total taxable value of land and additions on the property. | Land | Improvement |
|---|---|---|---|---|
| 2025 | $4,100 | $265,800 | $20,800 | $245,000 |
| 2023 | $4,100 | $243,900 | $10,800 | $233,100 |
| 2022 | $3,946 | $247,100 | $10,800 | $236,300 |
| 2021 | $2,922 | $206,700 | $10,800 | $195,900 |
| 2020 | $3,158 | $190,300 | $10,800 | $179,500 |
| 2019 | $2,988 | $185,700 | $10,800 | $174,900 |
| 2018 | $2,274 | $180,900 | $10,800 | $170,100 |
| 2017 | $2,410 | $147,900 | $10,800 | $137,100 |
| 2016 | $1,322 | $0 | $0 | $0 |
| 2015 | $1,702 | $61,200 | $9,100 | $52,100 |
| 2014 | $1,334 | $0 | $0 | $0 |
Source: Public Records
Map
Nearby Homes
Your Personal Tour Guide
Ask me questions while you tour the home.