Estimated Value: $734,701 - $767,000
3
Beds
2
Baths
1,812
Sq Ft
$415/Sq Ft
Est. Value
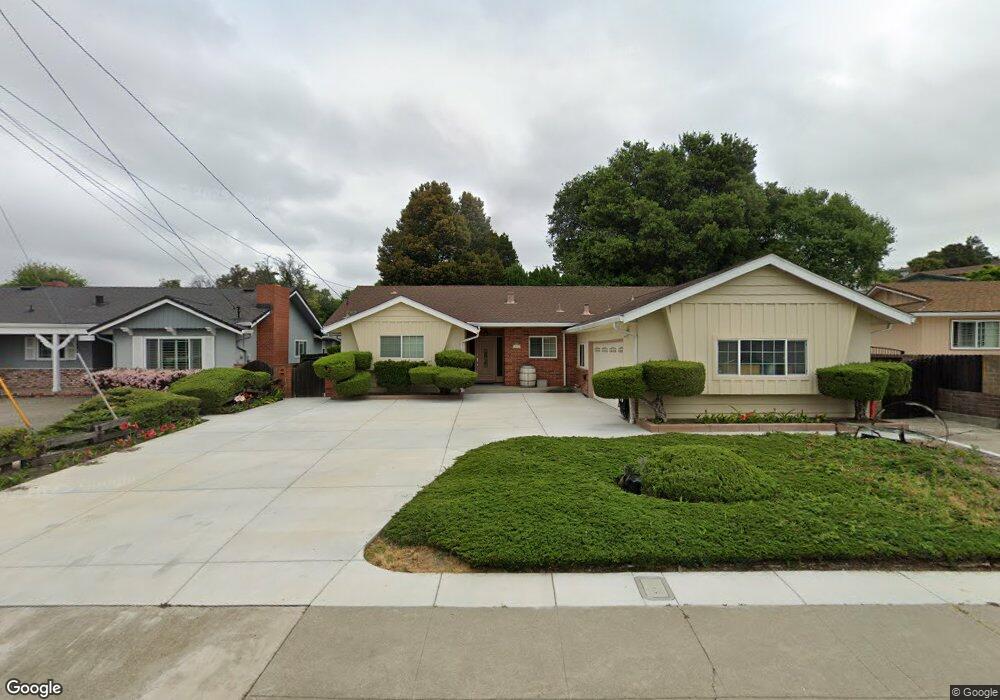
About This Home
This home is located at 743 Vaqueros Ave, Rodeo, CA 94572 and is currently estimated at $752,425, approximately $415 per square foot. 743 Vaqueros Ave is a home located in Contra Costa County with nearby schools including Rodeo Hills Elementary School, Carquinez Middle School, and John Swett High School.
Ownership History
Date
Name
Owned For
Owner Type
Purchase Details
Closed on
Mar 31, 2023
Sold by
Zermeno Sergio B
Bought by
Sergio B Zermeno Revocable Living Trust and Zermeno
Current Estimated Value
Purchase Details
Closed on
Oct 14, 2010
Sold by
Elias David S and Elias Susan J
Bought by
Zermeno Sergio B and Zermeno Irma Luevano
Home Financials for this Owner
Home Financials are based on the most recent Mortgage that was taken out on this home.
Original Mortgage
$242,250
Interest Rate
4.26%
Mortgage Type
New Conventional
Purchase Details
Closed on
Dec 29, 2008
Sold by
Elias Lucy M
Bought by
Elias Lucy M and Elias David S
Home Financials for this Owner
Home Financials are based on the most recent Mortgage that was taken out on this home.
Original Mortgage
$570,000
Interest Rate
2.15%
Mortgage Type
Reverse Mortgage Home Equity Conversion Mortgage
Create a Home Valuation Report for This Property
The Home Valuation Report is an in-depth analysis detailing your home's value as well as a comparison with similar homes in the area
Home Values in the Area
Average Home Value in this Area
Purchase History
| Date | Buyer | Sale Price | Title Company |
|---|---|---|---|
| Sergio B Zermeno Revocable Living Trust | -- | None Listed On Document | |
| Zermeno Sergio B | $285,000 | North American Title Co Inc | |
| Elias Lucy M | -- | North American Title Company | |
| Elias Lucy M | -- | North American Title Company |
Source: Public Records
Mortgage History
| Date | Status | Borrower | Loan Amount |
|---|---|---|---|
| Previous Owner | Zermeno Sergio B | $242,250 | |
| Previous Owner | Elias Lucy M | $570,000 |
Source: Public Records
Tax History
| Year | Tax Paid | Tax Assessment Tax Assessment Total Assessment is a certain percentage of the fair market value that is determined by local assessors to be the total taxable value of land and additions on the property. | Land | Improvement |
|---|---|---|---|---|
| 2025 | $5,953 | $365,124 | $108,894 | $256,230 |
| 2024 | $5,732 | $357,965 | $106,759 | $251,206 |
| 2023 | $5,732 | $350,947 | $104,666 | $246,281 |
| 2022 | $5,598 | $344,066 | $102,614 | $241,452 |
| 2021 | $5,496 | $337,320 | $100,602 | $236,718 |
| 2019 | $5,365 | $327,317 | $97,619 | $229,698 |
| 2018 | $5,224 | $320,900 | $95,705 | $225,195 |
| 2017 | $5,132 | $314,609 | $93,829 | $220,780 |
| 2016 | $4,723 | $308,441 | $91,990 | $216,451 |
| 2015 | $4,684 | $303,809 | $90,609 | $213,200 |
| 2014 | $4,619 | $297,859 | $88,835 | $209,024 |
Source: Public Records
Map
Nearby Homes
- 836 Hawthorne Dr
- 11 Fallen Leaf Ct
- 1012 Salt Spray Terrace
- 106 White Cap Cove
- 1334 7th St
- 900 Seascape Cir
- 834 Coral Ridge Cir
- 1101 Chelsea
- 797 Coral Ridge Cir
- 801 Dover
- 802 Dover
- 343 Rodeo Ave
- 120 Bonita Ct
- 704 Windsor Unit 704
- 511 Third St
- 405 Weymouth
- 338 Garretson Ave
- 176 Bedford
- 229 Lake Ave
- 205 Pacific Ave Unit 213
- 749 Vaqueros Ave
- 737 Vaqueros Ave
- 755 Vaqueros Ave
- 731 Vaqueros Ave
- 730 Vaqueros Ave
- 748 Vaqueros Ave
- 818 Spruce Ct
- 806 Spruce Ct
- 754 Vaqueros Ave
- 824 Spruce Ct
- 800 Spruce Ct
- 830 Spruce Ct
- 760 Vaqueros Ave
- 719 Vaqueros Ave
- 836 Spruce Ct
- 35 Cool Creek Ct
- 36 Cool Creek Ct
- 766 Vaqueros Ave
- 26 Summer Breeze Ct
- 819 Spruce Ct
Your Personal Tour Guide
Ask me questions while you tour the home.