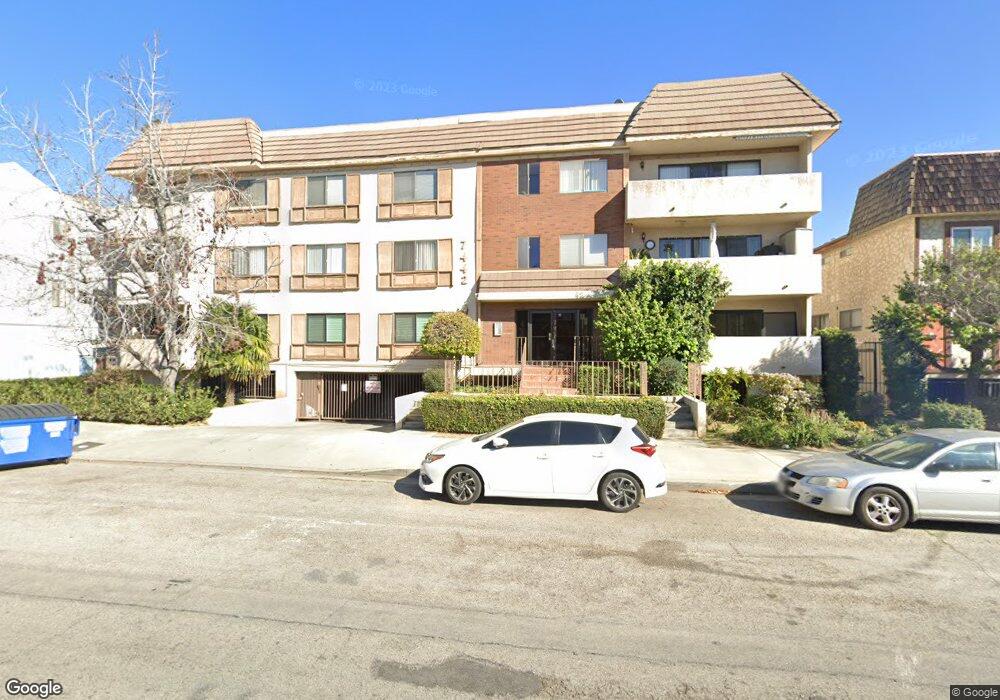
7442 Hazeltine Ave Unit 102 Van Nuys, CA 91405
Estimated Value: $493,810 - $524,000
2
Beds
2
Baths
1,220
Sq Ft
$418/Sq Ft
Est. Value
About This Home
This home is located at 7442 Hazeltine Ave Unit 102, Van Nuys, CA 91405 and is currently estimated at $509,453, approximately $417 per square foot. 7442 Hazeltine Ave Unit 102 is a home located in Los Angeles County with nearby schools including Hazeltine Avenue Elementary, Robert Fulton College Preparatory, and Panorama High School.
Ownership History
Date
Name
Owned For
Owner Type
Purchase Details
Closed on
Oct 14, 2013
Sold by
Kalemjyan Manuel
Bought by
Kalemjyan Manuel and Manuel Kalemjyan 2013 Revocable Living T
Current Estimated Value
Purchase Details
Closed on
Jan 27, 2010
Sold by
Taylor John Pierce and John Pierce Trust
Bought by
Kalemjyan Manuel
Home Financials for this Owner
Home Financials are based on the most recent Mortgage that was taken out on this home.
Original Mortgage
$135,000
Outstanding Balance
$88,725
Interest Rate
4.97%
Mortgage Type
New Conventional
Estimated Equity
$420,728
Purchase Details
Closed on
Jul 22, 2005
Sold by
Taylor John P
Bought by
Taylor John Pierce and The John Pierce Taylor Trust
Purchase Details
Closed on
Mar 12, 1996
Sold by
Taylor Maurine I
Bought by
Taylor Maurine I and The Maurine I Taylor Living Trust
Create a Home Valuation Report for This Property
The Home Valuation Report is an in-depth analysis detailing your home's value as well as a comparison with similar homes in the area
Home Values in the Area
Average Home Value in this Area
Purchase History
| Date | Buyer | Sale Price | Title Company |
|---|---|---|---|
| Kalemjyan Manuel | -- | None Available | |
| Kalemjyan Manuel | $180,000 | Lawyers Title Company | |
| Taylor John Pierce | -- | -- | |
| Taylor Maurine I | -- | -- |
Source: Public Records
Mortgage History
| Date | Status | Borrower | Loan Amount |
|---|---|---|---|
| Open | Kalemjyan Manuel | $135,000 |
Source: Public Records
Tax History Compared to Growth
Tax History
| Year | Tax Paid | Tax Assessment Tax Assessment Total Assessment is a certain percentage of the fair market value that is determined by local assessors to be the total taxable value of land and additions on the property. | Land | Improvement |
|---|---|---|---|---|
| 2025 | $2,905 | $232,335 | $46,463 | $185,872 |
| 2024 | $2,905 | $227,780 | $45,552 | $182,228 |
| 2023 | $2,851 | $223,314 | $44,659 | $178,655 |
| 2022 | $2,718 | $218,936 | $43,784 | $175,152 |
| 2021 | $2,680 | $214,644 | $42,926 | $171,718 |
| 2019 | $2,600 | $208,279 | $41,653 | $166,626 |
| 2018 | $2,581 | $204,196 | $40,837 | $163,359 |
| 2016 | $2,456 | $196,268 | $39,252 | $157,016 |
| 2015 | $2,421 | $193,321 | $38,663 | $154,658 |
| 2014 | $2,435 | $189,535 | $37,906 | $151,629 |
Source: Public Records
Map
Nearby Homes
- 7422 Hazeltine Ave Unit 2
- 7422 Hazeltine Ave Unit 3
- 7422 Hazeltine Ave Unit 7
- 7401 Costello Ave
- 7319 Hazeltine Ave Unit 11
- 7319 Hazeltine Ave Unit 5
- 13629 #108 Wyandotte
- 13918 Valerio St
- 14120 W Willow Ln
- 13951 Sherman Way Unit 301
- 6602 Ave Murietta
- 13903 Sherman Way Unit 7
- 13903 Sherman Way Unit 8
- 7134 Stansbury Ave
- 7320 Lennox Ave Unit F7
- 7300 Lennox Ave Unit J5
- 7419 N Mia Ln
- 7459 Sylmar Ave
- 13810 Sherman Way
- 7046 Murietta Ave
- 7442 Hazeltine Ave
- 7442 Hazeltine Ave Unit 303
- 7442 Hazeltine Ave Unit 302
- 7442 Hazeltine Ave Unit 304
- 7442 Hazeltine Ave Unit 301
- 7442 Hazeltine Ave Unit 203
- 7442 Hazeltine Ave Unit 202
- 7442 Hazeltine Ave Unit 204
- 7442 Hazeltine Ave Unit 201
- 7442 Hazeltine Ave Unit 103
- 7442 Hazeltine Ave Unit 104
- 7442 Hazeltine Ave Unit 101
- 7432 Hazeltine Ave Unit 10
- 7432 Hazeltine Ave Unit 9
- 7432 Hazeltine Ave Unit 8
- 7432 Hazeltine Ave Unit 7
- 7432 Hazeltine Ave Unit 6
- 7432 Hazeltine Ave Unit 5
- 7432 Hazeltine Ave Unit 4
- 7432 Hazeltine Ave Unit 3