Estimated Value: $642,000 - $762,000
2
Beds
2
Baths
1,080
Sq Ft
$646/Sq Ft
Est. Value
About This Home
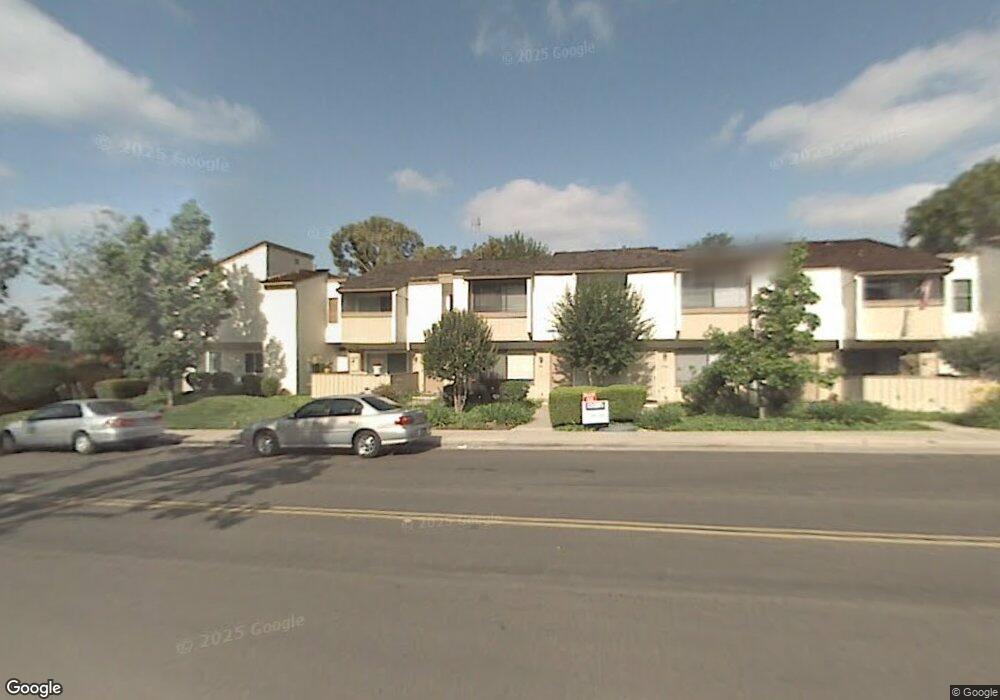
This home is located at 746 Cactus Ct, Brea, CA 92821 and is currently estimated at $697,763, approximately $646 per square foot. 746 Cactus Ct is a home located in Orange County with nearby schools including William E. Fanning Elementary School, Brea Junior High School, and Brea-Olinda High School.
Ownership History
Date
Name
Owned For
Owner Type
Purchase Details
Closed on
Oct 29, 2019
Sold by
Rad Moulouk Forouzan
Bought by
Arbela Holdings Llc
Current Estimated Value
Purchase Details
Closed on
Apr 22, 2002
Sold by
Broumand Moulouk
Bought by
Rad Moulouk Forouzan
Home Financials for this Owner
Home Financials are based on the most recent Mortgage that was taken out on this home.
Original Mortgage
$76,000
Interest Rate
7.18%
Create a Home Valuation Report for This Property
The Home Valuation Report is an in-depth analysis detailing your home's value as well as a comparison with similar homes in the area
Home Values in the Area
Average Home Value in this Area
Purchase History
| Date | Buyer | Sale Price | Title Company |
|---|---|---|---|
| Arbela Holdings Llc | -- | None Available | |
| Rad Moulouk Forouzan | -- | Commonwealth Land Title |
Source: Public Records
Mortgage History
| Date | Status | Borrower | Loan Amount |
|---|---|---|---|
| Previous Owner | Rad Moulouk Forouzan | $76,000 |
Source: Public Records
Tax History
| Year | Tax Paid | Tax Assessment Tax Assessment Total Assessment is a certain percentage of the fair market value that is determined by local assessors to be the total taxable value of land and additions on the property. | Land | Improvement |
|---|---|---|---|---|
| 2025 | $1,448 | $98,265 | $44,385 | $53,880 |
| 2024 | $1,448 | $96,339 | $43,515 | $52,824 |
| 2023 | $1,406 | $94,450 | $42,661 | $51,789 |
| 2022 | $6,597 | $566,100 | $497,051 | $69,049 |
| 2021 | $1,362 | $90,784 | $41,005 | $49,779 |
| 2020 | $1,352 | $89,854 | $40,585 | $49,269 |
| 2019 | $1,324 | $88,093 | $39,790 | $48,303 |
| 2018 | $1,305 | $86,366 | $39,010 | $47,356 |
| 2017 | $1,282 | $84,673 | $38,245 | $46,428 |
| 2016 | $1,259 | $83,013 | $37,495 | $45,518 |
| 2015 | $1,241 | $81,767 | $36,932 | $44,835 |
| 2014 | $1,207 | $80,166 | $36,209 | $43,957 |
Source: Public Records
Map
Nearby Homes
- 232 Dale Ct
- 149 Spring Ct
- 329 Surry Ct
- 360 Meadow Ct
- 688 Buttonwood Dr
- 648 Pepperwood Dr
- 38 Rogers Ct
- 753 Site Dr
- 448 W Central Ave
- 310 Pineridge St
- 1252 Tamarack Ave
- 145 S Poplar Ave Unit 20
- 127 S Redwood Ave
- 1445 Arrow Wood Dr
- 856 Williams St
- 1051 Site Dr Unit 236
- 1051 Site Dr Unit 255
- 1051 Site Dr Unit 89
- 1051 Site Dr Unit 25
- 1051 Site Dr Unit 251
Your Personal Tour Guide
Ask me questions while you tour the home.