Estimated Value: $467,000 - $565,000
2
Beds
2
Baths
1,190
Sq Ft
$425/Sq Ft
Est. Value
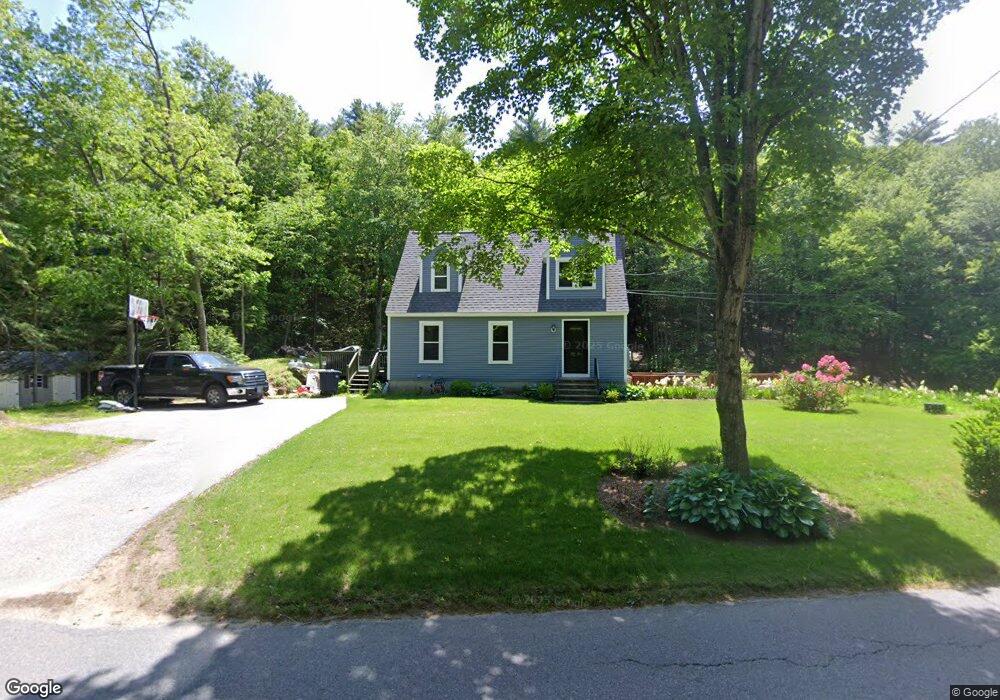
About This Home
This home is located at 75 Gulf Rd, Derry, NH 03038 and is currently estimated at $506,243, approximately $425 per square foot. 75 Gulf Rd is a home located in Rockingham County with nearby schools including East Derry Memorial Elementary School, West Running Brook Middle School, and Pinkerton Academy.
Ownership History
Date
Name
Owned For
Owner Type
Purchase Details
Closed on
Nov 3, 2025
Sold by
Lamport Richard L
Bought by
Richard L Lamport Ret and Lamport
Current Estimated Value
Purchase Details
Closed on
Sep 14, 1994
Bought by
Lamport Richard L
Create a Home Valuation Report for This Property
The Home Valuation Report is an in-depth analysis detailing your home's value as well as a comparison with similar homes in the area
Home Values in the Area
Average Home Value in this Area
Purchase History
| Date | Buyer | Sale Price | Title Company |
|---|---|---|---|
| Richard L Lamport Ret | -- | -- | |
| Richard L Lamport Ret | -- | -- | |
| Lamport Richard L | -- | -- |
Source: Public Records
Mortgage History
| Date | Status | Borrower | Loan Amount |
|---|---|---|---|
| Previous Owner | Lamport Richard L | $164,800 | |
| Previous Owner | Lamport Richard L | $82,700 | |
| Previous Owner | Lamport Richard L | $152,500 |
Source: Public Records
Tax History
| Year | Tax Paid | Tax Assessment Tax Assessment Total Assessment is a certain percentage of the fair market value that is determined by local assessors to be the total taxable value of land and additions on the property. | Land | Improvement |
|---|---|---|---|---|
| 2025 | $7,324 | $385,700 | $199,900 | $185,800 |
| 2024 | $7,209 | $385,700 | $199,900 | $185,800 |
| 2023 | $7,193 | $347,800 | $169,900 | $177,900 |
| 2022 | $6,622 | $347,800 | $169,900 | $177,900 |
| 2021 | $6,386 | $257,900 | $131,800 | $126,100 |
| 2020 | $5,777 | $257,900 | $131,800 | $126,100 |
| 2019 | $6,232 | $238,600 | $103,700 | $134,900 |
| 2018 | $5,606 | $238,600 | $103,700 | $134,900 |
| 2017 | $11,553 | $206,000 | $98,900 | $107,100 |
| 2016 | $5,574 | $206,000 | $98,900 | $107,100 |
| 2015 | $5,627 | $192,500 | $98,900 | $93,600 |
| 2014 | $5,663 | $192,500 | $98,900 | $93,600 |
| 2013 | $5,860 | $186,100 | $91,300 | $94,800 |
Source: Public Records
Map
Nearby Homes
- 11 Bartlett Rd
- 35 Steele Rd
- 343 Island Pond Rd
- 114 Chases Grove Rd
- 120 Chases Grove Rd
- 128 N Shore Rd
- 105 Conleys Grove Rd
- 9 Valcat Ln
- 4 Westview Dr
- 242 Rockingham Rd
- 398 N Main St
- 37 Coles Way
- 5 Stone Fence Dr
- 69 Caddy Dr
- 71 Caddy Dr
- 65 Caddy Dr
- 84 Caddy Dr
- 15 King St
- 118-1 Mills Shore Dr
- 118 Mills Shore Dr
Your Personal Tour Guide
Ask me questions while you tour the home.