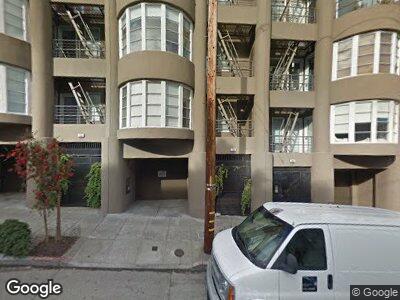
750 N Point St Unit 3 San Francisco, CA 94109
Russian Hill NeighborhoodEstimated Value: $1,621,000 - $2,335,000
--
Bed
--
Bath
1,683
Sq Ft
$1,136/Sq Ft
Est. Value
About This Home
This home is located at 750 N Point St Unit 3, San Francisco, CA 94109 and is currently estimated at $1,911,344, approximately $1,135 per square foot. 750 N Point St Unit 3 is a home located in San Francisco County with nearby schools including Yick Wo Elementary School, Francisco Middle School, and Sts. Peter And Paul K-8.
Ownership History
Date
Name
Owned For
Owner Type
Purchase Details
Closed on
Dec 12, 2024
Sold by
Marital Qtip Trust and Thomas E Randlett Trust
Bought by
Randlett Thomas Wade and Randlett Bradley Hale
Current Estimated Value
Purchase Details
Closed on
Jun 26, 2020
Sold by
Randlett James E and Thomas E Randlett Trust
Bought by
Randlett James E and Marital Qtip Trust
Purchase Details
Closed on
May 14, 2008
Sold by
Randlett Thomas E
Bought by
Randlett Thomas E and The Thomas E Randlett Trust
Purchase Details
Closed on
Apr 12, 2001
Sold by
Naughton Peter and Naughton Bernadette
Bought by
Randlett Thomas E
Home Financials for this Owner
Home Financials are based on the most recent Mortgage that was taken out on this home.
Original Mortgage
$600,000
Interest Rate
6.98%
Create a Home Valuation Report for This Property
The Home Valuation Report is an in-depth analysis detailing your home's value as well as a comparison with similar homes in the area
Home Values in the Area
Average Home Value in this Area
Purchase History
| Date | Buyer | Sale Price | Title Company |
|---|---|---|---|
| Randlett Thomas Wade | -- | None Listed On Document | |
| Randlett Thomas Wade | -- | None Listed On Document | |
| Randlett James E | -- | None Available | |
| Randlett Thomas E | -- | None Available | |
| Randlett Thomas E | $37,500 | Old Republic Title Company |
Source: Public Records
Mortgage History
| Date | Status | Borrower | Loan Amount |
|---|---|---|---|
| Previous Owner | Randlett Thomas E | $380,000 | |
| Previous Owner | Randlett Thomas E | $413,000 | |
| Previous Owner | Randlett Thomas E | $580,000 | |
| Previous Owner | Randlett Thomas E | $600,000 |
Source: Public Records
Tax History Compared to Growth
Tax History
| Year | Tax Paid | Tax Assessment Tax Assessment Total Assessment is a certain percentage of the fair market value that is determined by local assessors to be the total taxable value of land and additions on the property. | Land | Improvement |
|---|---|---|---|---|
| 2024 | $18,371 | $1,551,152 | $738,643 | $812,509 |
| 2023 | $18,063 | $1,520,738 | $724,160 | $796,578 |
| 2022 | $17,726 | $1,490,920 | $709,961 | $780,959 |
| 2021 | $17,421 | $1,461,688 | $696,041 | $765,647 |
| 2020 | $17,474 | $1,446,701 | $688,904 | $757,797 |
| 2019 | $16,875 | $1,418,336 | $675,397 | $742,939 |
| 2018 | $16,310 | $1,390,526 | $662,154 | $728,372 |
| 2017 | $16,119 | $1,363,262 | $649,171 | $714,091 |
| 2016 | $15,866 | $1,336,533 | $636,443 | $700,090 |
| 2015 | $15,673 | $1,316,458 | $626,884 | $689,574 |
| 2014 | $15,262 | $1,290,672 | $614,605 | $676,067 |
Source: Public Records
Map
Nearby Homes
- 762 Bay St
- 2606 Hyde St
- 785 Bay St
- 740 Francisco St
- 870 N Point St Unit A
- 915 N Point St Unit S2
- 915 N Point St Unit M3
- 915 N Point St Unit 307
- 915 N Point St Unit 306
- 915 N Point St Unit 305
- 915 N Point St Unit 302
- 36 Houston St
- 1052 Chestnut St
- 1054 Chestnut St
- 1080 Chestnut St Unit 11B
- 1080 Chestnut St Unit 11C
- 764 Chestnut St
- 900 N Point St Unit 710
- 900 N Point St Unit 619
- 900 N Point St Unit 411
- 750 N Point St Unit 3
- 750 N Point St Unit 2
- 750 N Point St Unit 1
- 758 N Point St Unit 1
- 758 N Point St Unit 3
- 758 N Point St Unit IT1
- 758 N Point St Unit 2
- 738 N Point St
- 748 N Point St Unit 2
- 748 N Point St Unit 1
- 748 N Point St Unit IT2
- 760 N Point St
- 714 N Point St
- 764 N Point St
- 710 N Point St
- 725 N Point St
- 708 N Point St Unit T2
- 708 N Point St Unit T1
- 708 N Point St Unit IT3
- 729 N Point St