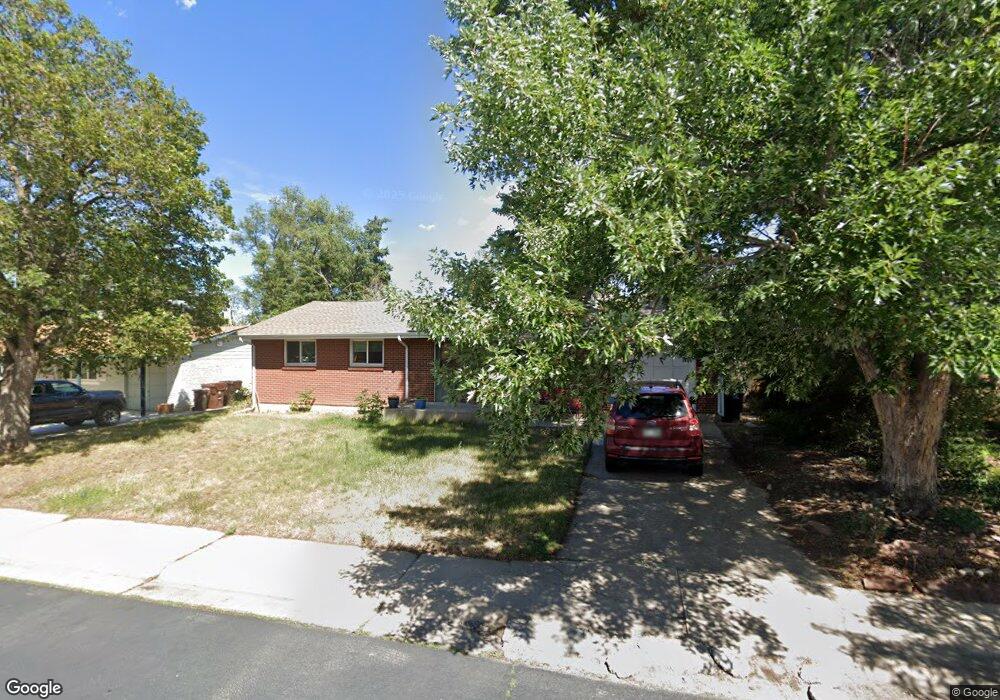
750 S 44th St Boulder, CO 80305
South Boulder NeighborhoodEstimated Value: $828,626 - $938,000
4
Beds
4
Baths
1,107
Sq Ft
$812/Sq Ft
Est. Value
About This Home
This home is located at 750 S 44th St, Boulder, CO 80305 and is currently estimated at $898,907, approximately $812 per square foot. 750 S 44th St is a home located in Boulder County with nearby schools including Creekside Elementary School, Southern Hills Middle School, and Fairview High School.
Ownership History
Date
Name
Owned For
Owner Type
Purchase Details
Closed on
Mar 26, 2019
Sold by
Sprod Ian E and Gallovic Beth A
Bought by
Sprod Ian E
Current Estimated Value
Home Financials for this Owner
Home Financials are based on the most recent Mortgage that was taken out on this home.
Original Mortgage
$13,000
Outstanding Balance
$11,429
Interest Rate
4.3%
Mortgage Type
New Conventional
Estimated Equity
$887,478
Purchase Details
Closed on
Jul 26, 1999
Sold by
Rockafellow Raymond T and Rockafellow Judy N
Bought by
Gallovic Beth A
Home Financials for this Owner
Home Financials are based on the most recent Mortgage that was taken out on this home.
Original Mortgage
$231,800
Outstanding Balance
$65,675
Interest Rate
7.47%
Estimated Equity
$833,232
Purchase Details
Closed on
Aug 23, 1972
Bought by
Gallovic Beth A and Sprod Ian E
Create a Home Valuation Report for This Property
The Home Valuation Report is an in-depth analysis detailing your home's value as well as a comparison with similar homes in the area
Home Values in the Area
Average Home Value in this Area
Purchase History
| Date | Buyer | Sale Price | Title Company |
|---|---|---|---|
| Sprod Ian E | -- | Land Title Guarantee | |
| Gallovic Beth A | $244,000 | Stewart Title | |
| Gallovic Beth A | $27,400 | -- |
Source: Public Records
Mortgage History
| Date | Status | Borrower | Loan Amount |
|---|---|---|---|
| Open | Sprod Ian E | $13,000 | |
| Open | Gallovic Beth A | $231,800 |
Source: Public Records
Tax History Compared to Growth
Tax History
| Year | Tax Paid | Tax Assessment Tax Assessment Total Assessment is a certain percentage of the fair market value that is determined by local assessors to be the total taxable value of land and additions on the property. | Land | Improvement |
|---|---|---|---|---|
| 2025 | $4,833 | $51,326 | $29,713 | $21,613 |
| 2024 | $4,833 | $51,326 | $29,713 | $21,613 |
| 2023 | $4,749 | $54,994 | $35,115 | $23,564 |
| 2022 | $4,200 | $45,224 | $26,139 | $19,085 |
| 2021 | $4,005 | $46,525 | $26,891 | $19,634 |
| 2020 | $3,865 | $44,402 | $25,383 | $19,019 |
| 2019 | $3,806 | $44,402 | $25,383 | $19,019 |
| 2018 | $3,592 | $41,429 | $23,400 | $18,029 |
| 2017 | $3,480 | $45,802 | $25,870 | $19,932 |
| 2016 | $3,221 | $37,213 | $16,318 | $20,895 |
| 2015 | $3,050 | $29,953 | $11,940 | $18,013 |
| 2014 | $2,518 | $29,953 | $11,940 | $18,013 |
Source: Public Records
Map
Nearby Homes
- 725 S 45th St
- 611 Tantra Dr
- 960 Toedtli Dr
- 1019 Tantra Park Cir
- 800 W Moorhead Cir Unit E
- 850 W Moorhead Cir Unit 3L
- 750 W Moorhead Cir Unit A
- 4763 Tantra Dr Unit B
- 450 S 41st St
- 860 W Moorhead Cir Unit I
- 860 W Moorhead Cir Unit 2K
- 860 W Moorhead Cir Unit 2H
- 450 S 40th St
- 4733 W Moorhead Cir
- 4350 Butler Cir
- 4475 Hastings Dr
- 4814 W Moorhead Cir
- 4293 Graham Ct
- 15 Pawnee Dr
- 4630 MacKy Way