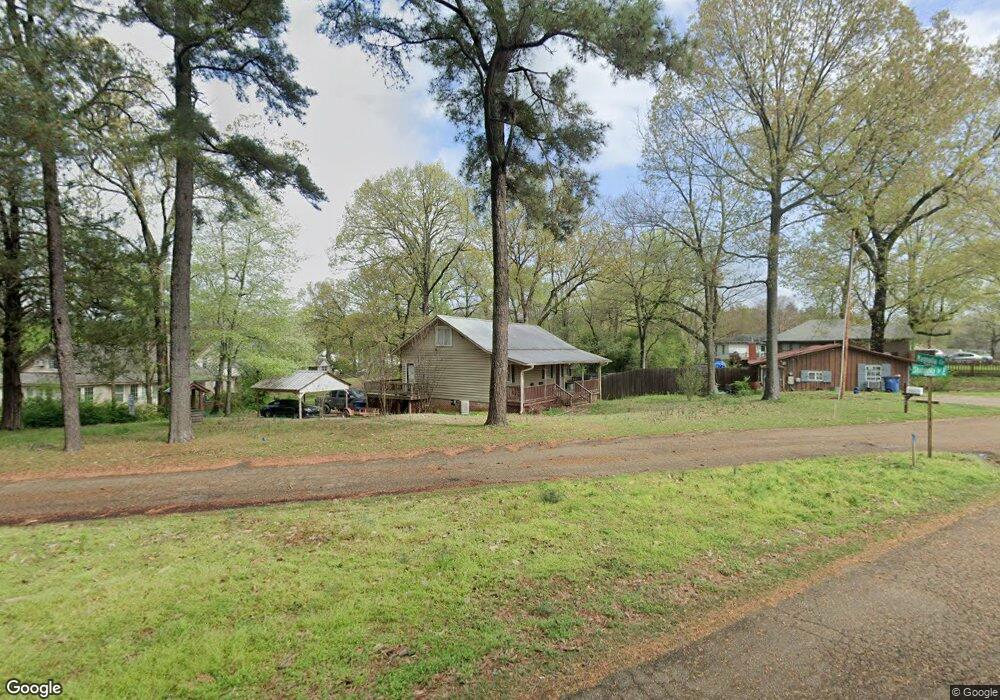
7500 Shahkoka Dr Olive Branch, MS 38654
Estimated Value: $163,000 - $196,000
3
Beds
2
Baths
1,369
Sq Ft
$132/Sq Ft
Est. Value
About This Home
This home is located at 7500 Shahkoka Dr, Olive Branch, MS 38654 and is currently estimated at $181,067, approximately $132 per square foot. 7500 Shahkoka Dr is a home located in DeSoto County with nearby schools including Olive Branch Elementary School, Chickasaw Elementary School, and Olive Branch Middle School.
Ownership History
Date
Name
Owned For
Owner Type
Purchase Details
Closed on
Dec 3, 2019
Sold by
Hodges Greenlee J and Hodges Rebecca
Bought by
Fortenberry Anna M
Current Estimated Value
Purchase Details
Closed on
Nov 18, 2018
Sold by
Barnes Melanie Gail and Barnes Jones Perry
Bought by
Greenlee J Lane and Hodges Rebecca
Purchase Details
Closed on
Dec 7, 2017
Sold by
Barnes Melanie Gail
Bought by
Barnes Melanie Gail and Barnes James Perry
Purchase Details
Closed on
Jul 11, 2017
Sold by
Bruce Randall J
Bought by
Barnes Melanie Gail and Randall J Bruce Revocable Trust
Create a Home Valuation Report for This Property
The Home Valuation Report is an in-depth analysis detailing your home's value as well as a comparison with similar homes in the area
Home Values in the Area
Average Home Value in this Area
Purchase History
| Date | Buyer | Sale Price | Title Company |
|---|---|---|---|
| Fortenberry Anna M | -- | None Available | |
| Greenlee J Lane | -- | None Available | |
| Barnes Melanie Gail | -- | -- | |
| Barnes Melanie Gail | -- | None Available | |
| Barnes Melanie Gail | -- | None Available |
Source: Public Records
Tax History Compared to Growth
Tax History
| Year | Tax Paid | Tax Assessment Tax Assessment Total Assessment is a certain percentage of the fair market value that is determined by local assessors to be the total taxable value of land and additions on the property. | Land | Improvement |
|---|---|---|---|---|
| 2024 | $620 | $4,546 | $1,000 | $3,546 |
| 2023 | $620 | $4,546 | $0 | $0 |
| 2022 | $725 | $5,311 | $1,000 | $4,311 |
| 2021 | $725 | $5,311 | $1,000 | $4,311 |
| 2020 | $677 | $4,961 | $1,000 | $3,961 |
| 2019 | $677 | $4,961 | $1,000 | $3,961 |
| 2017 | $688 | $9,032 | $5,016 | $4,016 |
| 2016 | $688 | $5,016 | $1,000 | $4,016 |
| 2015 | $688 | $9,032 | $5,016 | $4,016 |
| 2014 | $688 | $5,016 | $0 | $0 |
| 2013 | $668 | $5,016 | $0 | $0 |
Source: Public Records
Map
Nearby Homes
- 7356 Mockingbird Ln
- 7975 Crescent Cir
- 7305 Redbud Ln
- 7843 Ferndale Dr
- 7826 Ferndale Dr
- 8390 Ms-178
- 7880 Allenwood Ln
- 7759 Ferndale Dr
- 7888 Allenwood Ln
- 7721 Ferndale Dr
- 7736 Ferndale Dr
- 7859 Gardendale Dr
- 7867 Gardendale Dr
- 7875 Gardendale Dr
- 7881 Gardendale Dr
- 7899 Gardendale Dr
- 7905 Gardendale Dr
- 1930 Plan at Allendale
- 8484 Goodman Rd
- 8568 Goodman Rd
- 7500 Shahkoka Dr
- 7500 Dogwood Ln
- 7542 Magnolia Cir
- 7509 E Shahkoka Dr
- 7530 Dogwood Ln
- 8065 Shahkoka Dr
- 7523 Dogwood Ln
- 7385 Mockingbird Ln
- 7515 Shahkoka Dr
- 7535 Shahkoka Dr
- 7375 Shahkoka Dr
- 15 Dogwood Ln
- 7525 Shahkoka Dr
- 7525 Shahkoka Dr
- 8045 Shahkoka Dr
- 7525 Dogwood Ln
- 7492 Magnolia Cir
- 8103 Maywood Dr
- 7365 Mockingbird Ln
- 7392 Mockingbird Ln