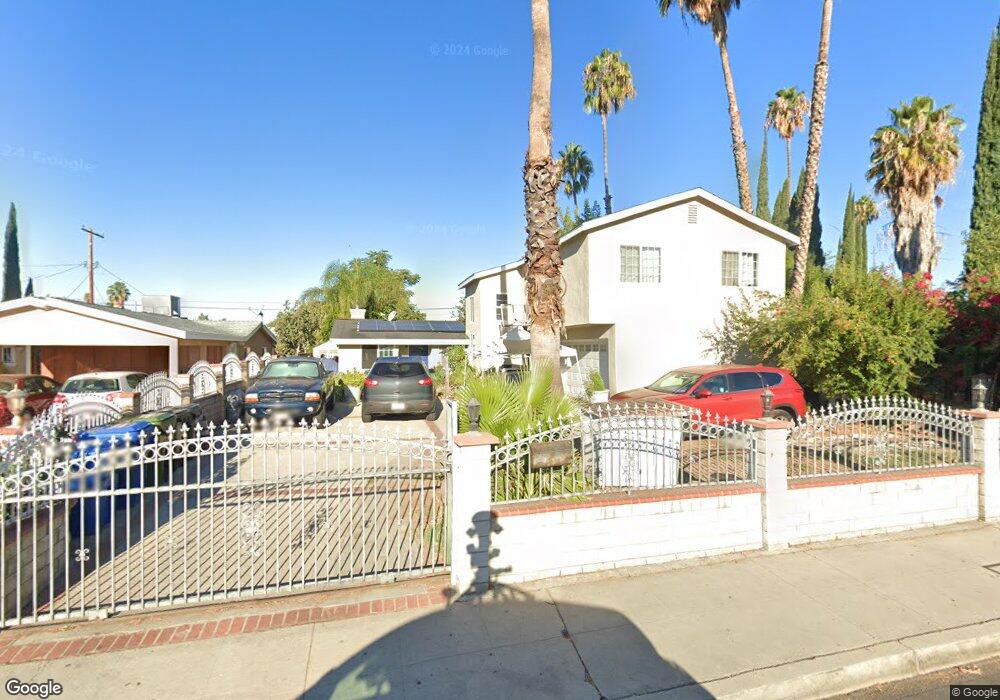
7507 Lurline Ave Winnetka, CA 91306
Estimated Value: $1,121,757 - $1,636,000
7
Beds
5
Baths
3,003
Sq Ft
$432/Sq Ft
Est. Value
About This Home
This home is located at 7507 Lurline Ave, Winnetka, CA 91306 and is currently estimated at $1,298,189, approximately $432 per square foot. 7507 Lurline Ave is a home located in Los Angeles County with nearby schools including Sunny Brae Avenue Elementary School, John A. Sutter Middle School, and Canoga Park Senior High School.
Ownership History
Date
Name
Owned For
Owner Type
Purchase Details
Closed on
Jul 6, 2015
Sold by
The Lorena Izales Living Trust
Bought by
Izales Amanda Lorena
Current Estimated Value
Home Financials for this Owner
Home Financials are based on the most recent Mortgage that was taken out on this home.
Original Mortgage
$286,000
Outstanding Balance
$222,928
Interest Rate
3.85%
Mortgage Type
New Conventional
Estimated Equity
$1,075,261
Purchase Details
Closed on
Mar 3, 2008
Sold by
Izales Lorena Amanda
Bought by
The Lorena Izales Living Trust
Purchase Details
Closed on
Sep 14, 1993
Sold by
Gral Thomas
Bought by
Arevalo Maximo
Home Financials for this Owner
Home Financials are based on the most recent Mortgage that was taken out on this home.
Original Mortgage
$128,000
Interest Rate
7.38%
Create a Home Valuation Report for This Property
The Home Valuation Report is an in-depth analysis detailing your home's value as well as a comparison with similar homes in the area
Home Values in the Area
Average Home Value in this Area
Purchase History
| Date | Buyer | Sale Price | Title Company |
|---|---|---|---|
| Izales Amanda Lorena | -- | Pacific Coast Title Company | |
| The Lorena Izales Living Trust | -- | None Available | |
| Arevalo Maximo | $160,000 | Southland Title Corporation |
Source: Public Records
Mortgage History
| Date | Status | Borrower | Loan Amount |
|---|---|---|---|
| Open | Izales Amanda Lorena | $286,000 | |
| Previous Owner | Arevalo Maximo | $128,000 | |
| Closed | Arevalo Maximo | $16,000 |
Source: Public Records
Tax History Compared to Growth
Tax History
| Year | Tax Paid | Tax Assessment Tax Assessment Total Assessment is a certain percentage of the fair market value that is determined by local assessors to be the total taxable value of land and additions on the property. | Land | Improvement |
|---|---|---|---|---|
| 2025 | $7,055 | $568,976 | $186,042 | $382,934 |
| 2024 | $7,055 | $557,821 | $182,395 | $375,426 |
| 2023 | $6,922 | $546,884 | $178,819 | $368,065 |
| 2022 | $6,607 | $536,162 | $175,313 | $360,849 |
| 2021 | $6,512 | $525,650 | $171,876 | $353,774 |
| 2019 | $6,319 | $510,061 | $166,779 | $343,282 |
| 2018 | $6,175 | $500,060 | $163,509 | $336,551 |
| 2016 | $5,874 | $480,643 | $157,160 | $323,483 |
| 2015 | $5,789 | $473,424 | $154,800 | $318,624 |
| 2014 | -- | $464,151 | $151,768 | $312,383 |
Source: Public Records
Map
Nearby Homes
- 20650 Covello St
- 20646 Hatton St
- 20551 Saticoy St
- 20722 Keswick St
- 7463 Mason Ave
- 20854 Runnymede St
- 7614 Mason Ave
- 7447 Loma Verde Ave
- 7800 Fairchild Ave
- 7506 Independence Ave
- 7812 Fairchild Ave
- 7230 Kelvin Ave Unit 6
- 7801 Kelvin Ave
- 7830 Fairchild Ave
- 7327 Loma Verde Ave
- 20431 Stagg St
- 7233 Loma Verde Ave
- 7767 Independence Ave
- 7549 Variel Ave
- 20448 Arminta St
- 7513 Lurline Ave
- 7515 Lurline Ave Unit 7513
- 7515 Lurline Ave
- 7501 Lurline Ave
- 20721 Cohasset St
- 20719 Cohasset St
- 7521 Lurline Ave
- 7457 Lurline Ave
- 7506 Irondale Ave
- 7510 Lurline Ave
- 7514 Irondale Ave
- 7500 Irondale Ave
- 20656 Covello St
- 20657 Cohasset St
- 7520 Irondale Ave
- 7456 Irondale Ave
- 7451 Lurline Ave
- 7527 Lurline Ave
- 20651 Cohasset St
- 7450 Irondale Ave