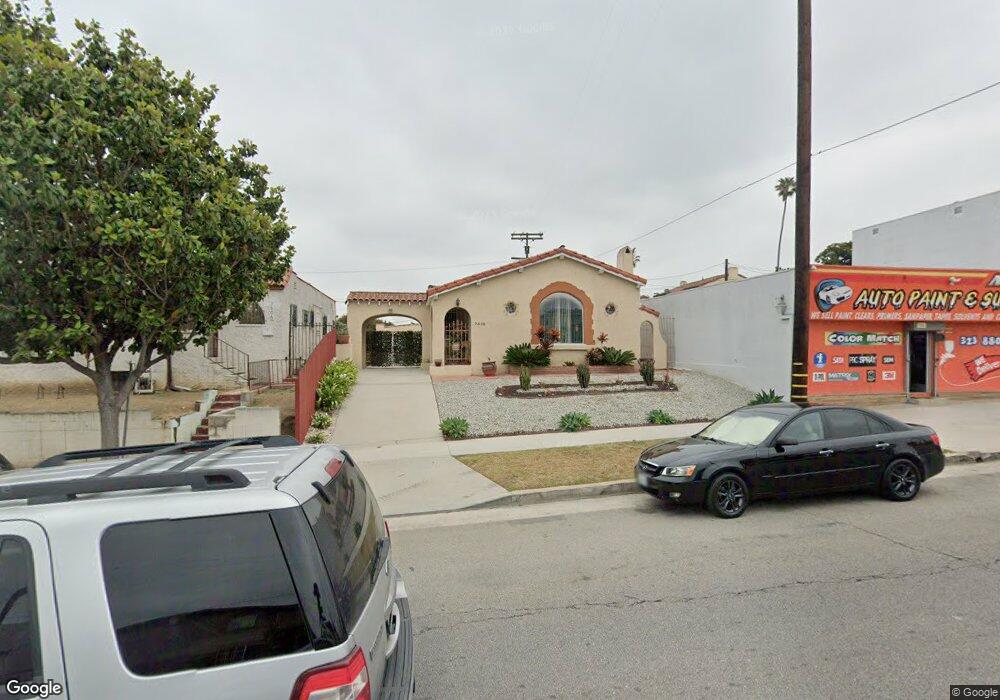
7510 Crenshaw Blvd Los Angeles, CA 90043
Hyde Park NeighborhoodEstimated Value: $764,938 - $883,000
2
Beds
1
Bath
1,388
Sq Ft
$581/Sq Ft
Est. Value
About This Home
This home is located at 7510 Crenshaw Blvd, Los Angeles, CA 90043 and is currently estimated at $805,985, approximately $580 per square foot. 7510 Crenshaw Blvd is a home located in Los Angeles County with nearby schools including Seventy-Fourth Street Elementary School, Horace Mann Ucla Community, and Crenshaw Science, Technology, Engineering, Math And Medicine Magnet.
Ownership History
Date
Name
Owned For
Owner Type
Purchase Details
Closed on
Feb 29, 2008
Sold by
Stephan Russell H
Bought by
Stephan Russell H and Stephan Martha H
Current Estimated Value
Purchase Details
Closed on
Apr 27, 2000
Sold by
Carbajal Martha
Bought by
Stephan Russell H and Stephan Martha H
Purchase Details
Closed on
Mar 23, 1998
Sold by
Stephen Russell Harold
Bought by
Carbajal Martha
Purchase Details
Closed on
Mar 4, 1998
Sold by
Associates Home Equity Services Inc
Bought by
Carbajal Martha
Purchase Details
Closed on
Oct 10, 1997
Sold by
Mcneal George H
Bought by
Ford Consumer Finance Company Inc
Purchase Details
Closed on
Aug 4, 1997
Sold by
Mcneal George H
Bought by
Pace Phillip and Mcneal George H
Purchase Details
Closed on
Jun 12, 1997
Sold by
Mcneal George H
Bought by
Mcneal Shakir and Mcneal George H
Create a Home Valuation Report for This Property
The Home Valuation Report is an in-depth analysis detailing your home's value as well as a comparison with similar homes in the area
Home Values in the Area
Average Home Value in this Area
Purchase History
| Date | Buyer | Sale Price | Title Company |
|---|---|---|---|
| Stephan Russell H | -- | None Available | |
| Stephan Russell H | -- | -- | |
| Carbajal Martha | -- | First American Title Ins Co | |
| Carbajal Martha | $105,000 | First American Title Ins Co | |
| Ford Consumer Finance Company Inc | $90,000 | American Title Ins Co | |
| Pace Phillip | -- | -- | |
| Mcneal Shakir | -- | -- |
Source: Public Records
Tax History Compared to Growth
Tax History
| Year | Tax Paid | Tax Assessment Tax Assessment Total Assessment is a certain percentage of the fair market value that is determined by local assessors to be the total taxable value of land and additions on the property. | Land | Improvement |
|---|---|---|---|---|
| 2025 | $2,330 | $167,631 | $79,824 | $87,807 |
| 2024 | $2,330 | $164,345 | $78,259 | $86,086 |
| 2023 | $2,295 | $161,124 | $76,725 | $84,399 |
| 2022 | $2,203 | $157,966 | $75,221 | $82,745 |
| 2021 | $2,168 | $154,870 | $73,747 | $81,123 |
| 2019 | $2,111 | $150,278 | $71,560 | $78,718 |
| 2018 | $2,026 | $147,332 | $70,157 | $77,175 |
| 2016 | $1,931 | $141,613 | $67,434 | $74,179 |
| 2015 | $1,906 | $139,487 | $66,422 | $73,065 |
| 2014 | $1,923 | $136,755 | $65,121 | $71,634 |
Source: Public Records
Map
Nearby Homes
- 3155 W 76th St
- 7716 1/2 Crenshaw Blvd
- 7323 Crenshaw Blvd
- 7806 Crenshaw Blvd
- 7810 Crenshaw Blvd
- 7220 10th Ave
- 4719 4719 S 8th Ave
- 7830 S Victoria Ave
- 3311 W 79th St
- 2923 W 76th St
- 3201 W Florence Ave
- 3012 W 73rd St
- 3500 W 78th St
- 3120 W 71st St
- 3436 W 79th St
- 6812 11th Ave
- 2603 W 75th St
- 7036 6th Ave
- 6800 West Blvd
- 3414 W 82nd St
- 7506 Crenshaw Blvd
- 7502 Crenshaw Blvd
- 3318 W 75th St
- 3317 W 76th St
- 3314 W 75th St
- 3313 W 76th St
- 3308 W 75th St
- 3309 W 76th St
- 7503 Crenshaw Blvd
- 7521 Crenshaw Blvd Unit 8
- 7521 Crenshaw Blvd Unit 10
- 7424 Crenshaw Blvd
- 3304 W 75th St
- 3305 W 76th St
- 7525 Crenshaw Blvd Unit 10
- 3319 W 75th St
- 3300 W 75th St
- 7418 Crenshaw Blvd
- 3315 W 75th St
- 3301 W 76th St