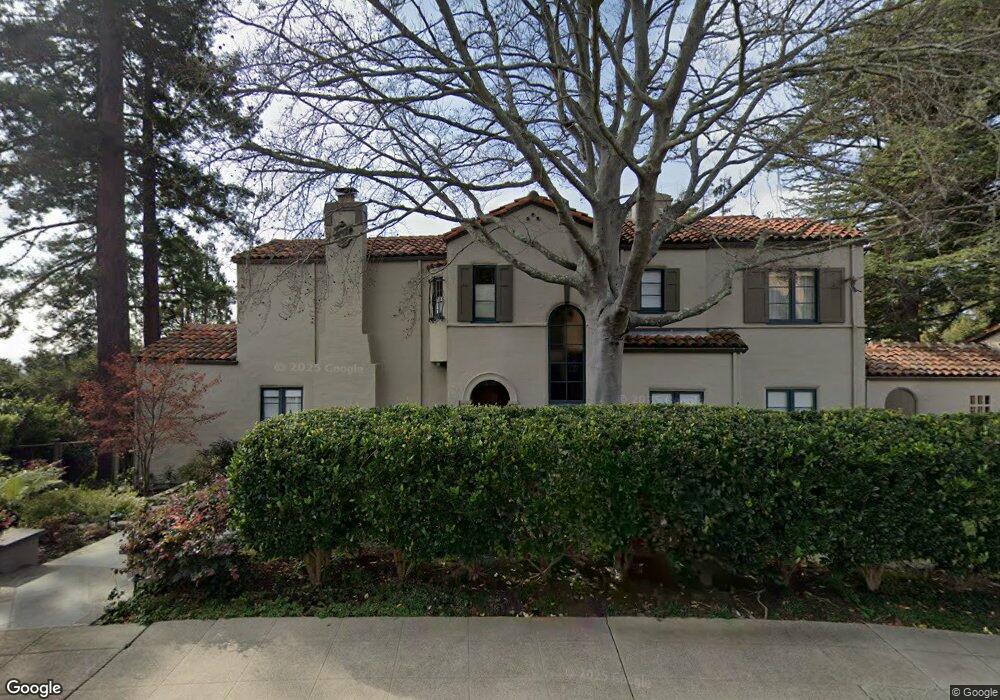
752 San Diego Rd Berkeley, CA 94707
Berkeley Hills NeighborhoodEstimated Value: $2,640,000 - $3,139,000
4
Beds
3
Baths
3,133
Sq Ft
$922/Sq Ft
Est. Value
About This Home
This home is located at 752 San Diego Rd, Berkeley, CA 94707 and is currently estimated at $2,889,876, approximately $922 per square foot. 752 San Diego Rd is a home located in Alameda County with nearby schools including Thousand Oaks Elementary School, Berkeley Arts Magnet at Whittier School, and Ruth Acty Elementary.
Ownership History
Date
Name
Owned For
Owner Type
Purchase Details
Closed on
Nov 17, 2017
Sold by
Moore David M and Moore Elena K
Bought by
Seto Jane and Peterson William L
Current Estimated Value
Home Financials for this Owner
Home Financials are based on the most recent Mortgage that was taken out on this home.
Original Mortgage
$1,000,000
Outstanding Balance
$832,807
Interest Rate
3.62%
Mortgage Type
Adjustable Rate Mortgage/ARM
Estimated Equity
$2,057,069
Purchase Details
Closed on
Mar 18, 1997
Sold by
Goldberg Stanley B and Goldberg Roberta
Bought by
Moore David M and Moore Elena K
Home Financials for this Owner
Home Financials are based on the most recent Mortgage that was taken out on this home.
Original Mortgage
$548,000
Interest Rate
7.87%
Purchase Details
Closed on
Dec 18, 1996
Sold by
Goldberg Stanley B and Goldberg Roberta
Bought by
Goldberg Stanley B and Goldberg Roberta
Purchase Details
Closed on
Mar 9, 1994
Sold by
Goldberg Stanley B and Goldberg Roberta
Bought by
Goldberg Stanley B and Goldberg Roberta
Create a Home Valuation Report for This Property
The Home Valuation Report is an in-depth analysis detailing your home's value as well as a comparison with similar homes in the area
Home Values in the Area
Average Home Value in this Area
Purchase History
| Date | Buyer | Sale Price | Title Company |
|---|---|---|---|
| Seto Jane | $2,350,000 | Chicago Title Company | |
| Moore David M | $685,000 | Placer Title Company | |
| Goldberg Stanley B | -- | -- | |
| Goldberg Stanley B | -- | -- |
Source: Public Records
Mortgage History
| Date | Status | Borrower | Loan Amount |
|---|---|---|---|
| Open | Seto Jane | $1,000,000 | |
| Previous Owner | Moore David M | $548,000 | |
| Closed | Moore David M | $68,500 |
Source: Public Records
Tax History
| Year | Tax Paid | Tax Assessment Tax Assessment Total Assessment is a certain percentage of the fair market value that is determined by local assessors to be the total taxable value of land and additions on the property. | Land | Improvement |
|---|---|---|---|---|
| 2025 | $38,246 | $2,666,853 | $802,156 | $1,871,697 |
| 2024 | $38,246 | $2,614,424 | $786,427 | $1,834,997 |
| 2023 | $37,420 | $2,570,030 | $771,009 | $1,799,021 |
| 2022 | $36,758 | $2,512,645 | $755,893 | $1,763,752 |
| 2021 | $36,898 | $2,463,248 | $741,074 | $1,729,174 |
| 2020 | $35,128 | $2,444,940 | $733,482 | $1,711,458 |
| 2019 | $33,971 | $2,397,000 | $719,100 | $1,677,900 |
| 2018 | $33,525 | $2,350,000 | $705,000 | $1,645,000 |
| 2017 | $18,098 | $1,005,140 | $288,376 | $716,764 |
| 2016 | $17,431 | $985,435 | $282,722 | $702,713 |
| 2015 | $17,150 | $970,637 | $278,477 | $692,160 |
| 2014 | $16,729 | $951,627 | $273,023 | $678,604 |
Source: Public Records
Map
Nearby Homes
- 765 San Diego Rd
- 1983 Yosemite Rd
- 770 Santa Barbara Rd
- 589 San Luis Rd
- 826 Indian Rock Ave
- 483 Boynton Ave
- 614 Cragmont Ave
- 385 Vermont Ave
- 410 Grizzly Peak Blvd
- 731 Grizzly Peak Blvd
- 890 Keeler Ave
- 753 Peralta Ave
- 1950 Hopkins St
- 962 Regal Rd
- 255 Stanford Ave
- 415 Berkeley Park Blvd
- 290 Colgate Ave
- 1024 Miller Ave
- 935 Grizzly Peak Blvd
- 731 Santa fe Ave
- 66 Southampton Ave
- 754 San Diego Rd
- 86 Southampton Ave
- 751 San Diego Rd
- 757 San Diego Rd
- 747 San Diego Rd
- 745 San Diego Rd
- 65 Southampton Ave
- 55 Southampton Ave
- 761 San Diego Rd
- 743 San Diego Rd
- 45 Southampton Ave
- 41 Southampton Ave
- 140 Southampton Ave
- 87 Southampton Ave
- 150 Southampton Ave
- 763 San Diego Rd
- 85 Southampton Ave
- 132 Southampton Ave
- 89 Southampton Ave
Your Personal Tour Guide
Ask me questions while you tour the home.