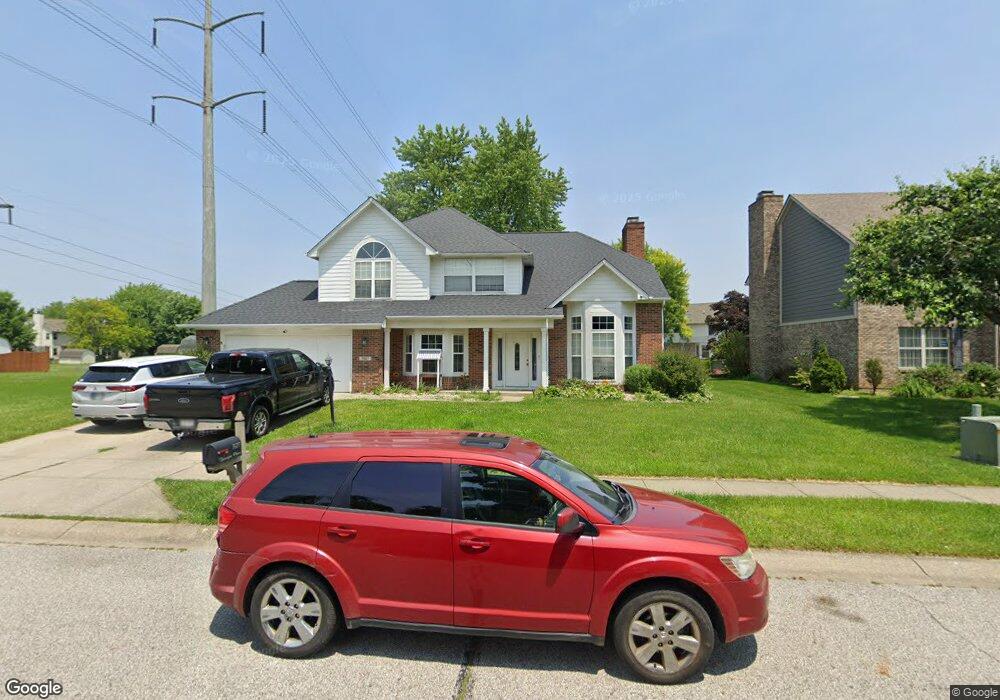
7527 Tarragon Place Indianapolis, IN 46237
South Perry NeighborhoodEstimated Value: $370,000 - $402,000
4
Beds
3
Baths
2,548
Sq Ft
$151/Sq Ft
Est. Value
About This Home
This home is located at 7527 Tarragon Place, Indianapolis, IN 46237 and is currently estimated at $384,854, approximately $151 per square foot. 7527 Tarragon Place is a home located in Marion County with nearby schools including Mary Bryan Elementary School, Southport 6th Grade Academy, and Southport Middle School.
Ownership History
Date
Name
Owned For
Owner Type
Purchase Details
Closed on
Aug 28, 2017
Sold by
Schneider Anthony J
Bought by
Miller Eric and Miller Kimberly A
Current Estimated Value
Home Financials for this Owner
Home Financials are based on the most recent Mortgage that was taken out on this home.
Original Mortgage
$216,015
Outstanding Balance
$184,350
Interest Rate
4.75%
Mortgage Type
FHA
Estimated Equity
$200,504
Create a Home Valuation Report for This Property
The Home Valuation Report is an in-depth analysis detailing your home's value as well as a comparison with similar homes in the area
Home Values in the Area
Average Home Value in this Area
Purchase History
| Date | Buyer | Sale Price | Title Company |
|---|---|---|---|
| Miller Eric | $220,000 | -- | |
| Miller Eric | $220,000 | Chicago Title Co Llc |
Source: Public Records
Mortgage History
| Date | Status | Borrower | Loan Amount |
|---|---|---|---|
| Open | Miller Eric | $216,015 |
Source: Public Records
Tax History Compared to Growth
Tax History
| Year | Tax Paid | Tax Assessment Tax Assessment Total Assessment is a certain percentage of the fair market value that is determined by local assessors to be the total taxable value of land and additions on the property. | Land | Improvement |
|---|---|---|---|---|
| 2024 | $4,451 | $369,600 | $57,000 | $312,600 |
| 2023 | $4,451 | $339,400 | $57,000 | $282,400 |
| 2022 | $4,200 | $313,800 | $57,000 | $256,800 |
| 2021 | $3,686 | $272,200 | $57,000 | $215,200 |
| 2020 | $3,281 | $241,700 | $57,000 | $184,700 |
| 2019 | $2,960 | $217,700 | $41,000 | $176,700 |
| 2018 | $2,988 | $222,000 | $41,000 | $181,000 |
| 2017 | $2,845 | $211,600 | $41,000 | $170,600 |
| 2016 | $2,847 | $211,600 | $41,000 | $170,600 |
| 2014 | $2,058 | $173,000 | $41,000 | $132,000 |
| 2013 | $2,007 | $168,700 | $41,000 | $127,700 |
Source: Public Records
Map
Nearby Homes
- 7519 Perilla Ct
- 4729 Chervil Ct
- 4549 Pepper Ct
- 7383 Poppyseed Dr
- 7525 Mcfarland Blvd
- 7820 Pennyroyal Ln
- 7804 Rosa Dr
- 4242 Saffron Dr
- 8015 Whitaker Valley Blvd
- 4704 Whitview Ln
- 4622 Whitview Ln
- 7832 Lascala Blvd
- 4960 Brookfield Dr
- 8121 Whitview Dr
- 3910 Mistletoe Dr
- 3911 Eastwind St
- 4609 Whitridge Ln
- 7624 Miracle Rd
- 8221 Rob Ln
- 3821 Gray Pond Ct
- 7537 Tarragon Place
- 7526 Perilla Ct
- 7540 Santolina Dr
- 7543 Tarragon Place
- 4747 Cinnamon Place
- 4755 Cinnamon Place
- 7520 Perilla Ct
- 7532 Perilla Ct
- 7546 Santolina Dr
- 4763 Cinnamon Dr
- 4763 Cinnamon Place
- 7542 Tarragon Place
- 7550 Perilla Ct
- 7542 Perilla Ct
- 7552 Santolina Dr
- 4771 Cinnamon Place
- 7508 Tarragon Place
- 7548 Tarragon Place
- 4777 Cinnamon Place
- 7558 Santolina Dr