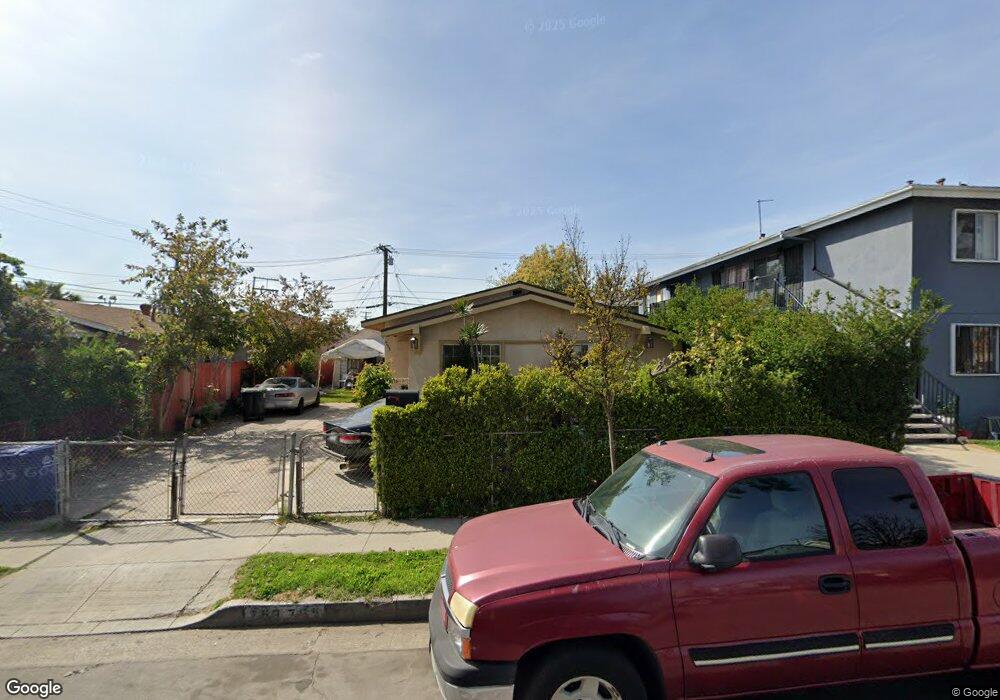
753 Findlay Ave Los Angeles, CA 90022
Estimated Value: $681,000 - $828,287
3
Beds
2
Baths
1,624
Sq Ft
$463/Sq Ft
Est. Value
About This Home
This home is located at 753 Findlay Ave, Los Angeles, CA 90022 and is currently estimated at $752,572, approximately $463 per square foot. 753 Findlay Ave is a home located in Los Angeles County with nearby schools including Bella Vista Elementary School, Macy Intermediate School, and Schurr High School.
Ownership History
Date
Name
Owned For
Owner Type
Purchase Details
Closed on
Nov 3, 2000
Sold by
Navarro Gonzalo and Navarro Juan
Bought by
Navarro Gonzalo and Murillo Hilda M
Current Estimated Value
Home Financials for this Owner
Home Financials are based on the most recent Mortgage that was taken out on this home.
Original Mortgage
$158,000
Interest Rate
7.71%
Purchase Details
Closed on
Jan 11, 1995
Sold by
Federal Home Loan Mortgage Corporation
Bought by
Navarro Gonzalo and Navarro Juan
Home Financials for this Owner
Home Financials are based on the most recent Mortgage that was taken out on this home.
Original Mortgage
$144,400
Interest Rate
9.16%
Purchase Details
Closed on
Sep 27, 1994
Sold by
Gonzales Moreno Edmundo and Gonzales Moreno Leticia
Bought by
Federal Home Loan Mortgage Corporation
Purchase Details
Closed on
Sep 10, 1993
Sold by
Beltran Jaime and Velasquez Jose J
Bought by
Moreno Edmundo
Create a Home Valuation Report for This Property
The Home Valuation Report is an in-depth analysis detailing your home's value as well as a comparison with similar homes in the area
Home Values in the Area
Average Home Value in this Area
Purchase History
| Date | Buyer | Sale Price | Title Company |
|---|---|---|---|
| Navarro Gonzalo | -- | United Title Company | |
| Navarro Gonzalo | -- | First American Title Company | |
| Navarro Gonzalo | -- | -- | |
| Federal Home Loan Mortgage Corporation | $185,000 | -- | |
| Moreno Edmundo | -- | -- |
Source: Public Records
Mortgage History
| Date | Status | Borrower | Loan Amount |
|---|---|---|---|
| Previous Owner | Navarro Gonzalo | $158,000 | |
| Previous Owner | Navarro Gonzalo | $144,400 |
Source: Public Records
Tax History Compared to Growth
Tax History
| Year | Tax Paid | Tax Assessment Tax Assessment Total Assessment is a certain percentage of the fair market value that is determined by local assessors to be the total taxable value of land and additions on the property. | Land | Improvement |
|---|---|---|---|---|
| 2025 | $4,342 | $267,007 | $154,330 | $112,677 |
| 2024 | $4,342 | $261,772 | $151,304 | $110,468 |
| 2023 | $4,172 | $256,640 | $148,338 | $108,302 |
| 2022 | $4,048 | $251,609 | $145,430 | $106,179 |
| 2021 | $3,926 | $246,677 | $142,579 | $104,098 |
| 2020 | $3,900 | $244,149 | $141,118 | $103,031 |
| 2019 | $3,798 | $239,362 | $138,351 | $101,011 |
| 2018 | $3,784 | $234,670 | $135,639 | $99,031 |
| 2016 | $3,626 | $225,560 | $130,373 | $95,187 |
| 2015 | $3,446 | $222,173 | $128,415 | $93,758 |
| 2014 | $3,417 | $217,822 | $125,900 | $91,922 |
Source: Public Records
Map
Nearby Homes
- 6114 Allston St
- 6074 Dennison St
- 413 Brady Ave
- 678 Saybrook Ave
- 6211 E Olympic Blvd
- 6128 E Olympic Blvd
- 631 Leonard Ave
- 3033 W Via Corona
- 5838 Allston St
- 668 Keenan Ave
- 601 Keenan Ave
- 6434 E Olympic Blvd
- 544 Keenan Ave
- 6501 E Olympic Blvd
- 532 Keenan Ave
- 3413 W Beverly Blvd
- 6057 Hereford Dr
- 6041 Ferguson Dr
- 2912 W Via Acosta
- 5643 E 6th St
- 757 Findlay Ave
- 747 Findlay Ave
- 743 Findlay Ave
- 758 Hendricks Ave
- 746 Hendricks Ave
- 737 Findlay Ave
- 742 Hendricks Ave
- 746 Findlay Ave
- 744 Hendricks Ave Unit 1
- 744 Hendricks Ave
- 733 Findlay Ave
- 736 Hendricks Ave
- 742 Findlay Ave
- 6101 Whittier Blvd
- 736 Findlay Ave
- 732 Hendricks Ave
- 727 Findlay Ave
- 732 Findlay Ave
- 724 Hendricks Ave
- 721 Findlay Ave