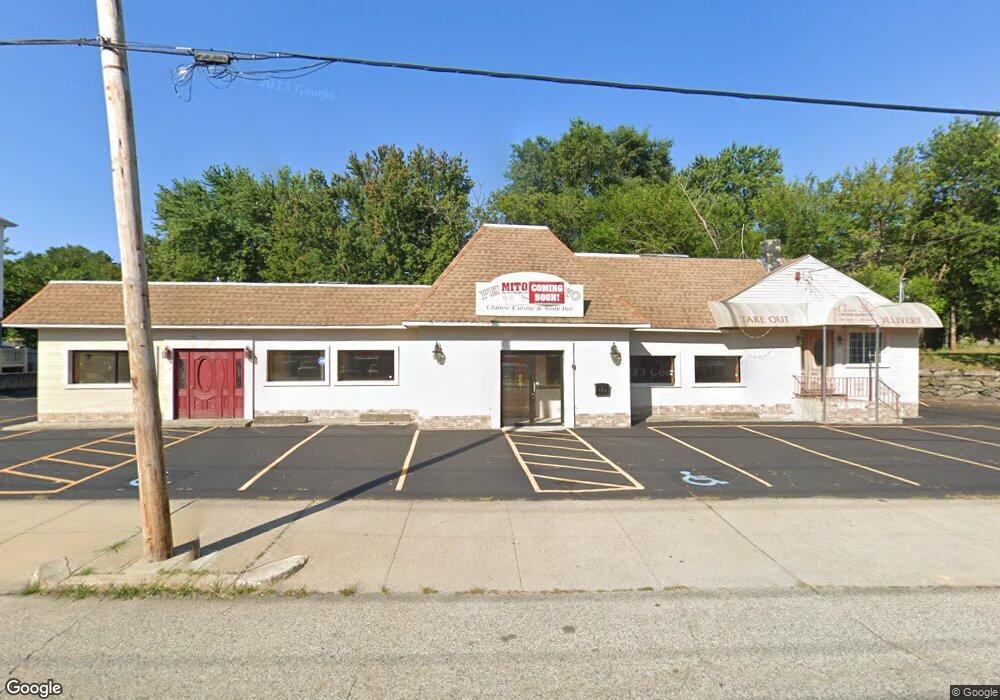
754 Front St Woonsocket, RI 02895
Globe District NeighborhoodEstimated Value: $305,071
Studio
--
Bath
6,000
Sq Ft
$51/Sq Ft
Est. Value
About This Home
This home is located at 754 Front St, Woonsocket, RI 02895 and is currently priced at $305,071, approximately $50 per square foot. 754 Front St is a home located in Providence County with nearby schools including Woonsocket High School, Founders Academy, and Beacon Charter School.
Ownership History
Date
Name
Owned For
Owner Type
Purchase Details
Closed on
May 22, 2019
Sold by
Woonsocket City Of
Bought by
Power Realty Rigp
Current Estimated Value
Purchase Details
Closed on
Oct 28, 2010
Sold by
Yang & Kong Llc
Bought by
Phuong Kim
Purchase Details
Closed on
Jun 9, 2010
Sold by
Cathay Bk
Bought by
Yang & Kong Llc
Purchase Details
Closed on
Jan 29, 2010
Sold by
Chow Daniel
Bought by
Cathy Bk
Purchase Details
Closed on
Sep 12, 2005
Sold by
Island Buffet Inc
Bought by
Front Assoc Llc
Purchase Details
Closed on
Jun 22, 1999
Sold by
Wang Chang Inc
Bought by
Cheng Wing Kwong
Create a Home Valuation Report for This Property
The Home Valuation Report is an in-depth analysis detailing your home's value as well as a comparison with similar homes in the area
Home Values in the Area
Average Home Value in this Area
Purchase History
| Date | Buyer | Sale Price | Title Company |
|---|---|---|---|
| Power Realty Rigp | $9,616 | -- | |
| Power Realty Rigp | $9,616 | -- | |
| Phuong Kim | $130,000 | -- | |
| Phuong Kim | $130,000 | -- | |
| Yang & Kong Llc | $110,000 | -- | |
| Cathay Bk | $200,000 | -- | |
| Cathay Bk | $200,000 | -- | |
| Cathy Bk | $200,000 | -- | |
| Cathy Bk | $200,000 | -- | |
| Front Assoc Llc | $200,000 | -- | |
| Front Assoc Llc | $200,000 | -- | |
| Cheng Wing Kwong | $200,000 | -- | |
| Cheng Wing Kwong | $200,000 | -- |
Source: Public Records
Mortgage History
| Date | Status | Borrower | Loan Amount |
|---|---|---|---|
| Previous Owner | Cheng Wing Kwong | $40,000 | |
| Previous Owner | Cheng Wing Kwong | $250,000 |
Source: Public Records
Tax History
| Year | Tax Paid | Tax Assessment Tax Assessment Total Assessment is a certain percentage of the fair market value that is determined by local assessors to be the total taxable value of land and additions on the property. | Land | Improvement |
|---|---|---|---|---|
| 2025 | $7,796 | $366,000 | $64,400 | $301,600 |
| 2024 | $8,213 | $304,400 | $53,200 | $251,200 |
| 2023 | $7,896 | $304,400 | $53,200 | $251,200 |
| 2022 | $7,896 | $304,400 | $53,200 | $251,200 |
| 2021 | $10,050 | $289,200 | $44,600 | $244,600 |
| 2020 | $10,191 | $289,200 | $44,600 | $244,600 |
| 2018 | $10,466 | $289,200 | $44,600 | $244,600 |
| 2017 | $7,375 | $199,700 | $46,500 | $153,200 |
| 2016 | $7,656 | $199,700 | $46,500 | $153,200 |
| 2015 | $8,128 | $199,700 | $46,500 | $153,200 |
| 2014 | $6,666 | $166,700 | $51,700 | $115,000 |
Source: Public Records
Map
Nearby Homes
- 0 Holbrook Ln Unit 1402850
- 379 Front St
- 122 Grand St
- 635 Park Ave
- 43 Summit St
- 435 S Main St
- 15 Knight St
- 99 Allen St Unit 205
- 190 Coe St
- 180 Allen St Unit 104
- 36 Fairmount St
- 184 Avenue C Unit 2
- 184 Avenue C Unit 5
- 184 Avenue C Unit 6
- 184 Avenue C Unit 3
- 184 Avenue C Unit 4
- 184 Avenue C Unit 1
- 83 4th Ave
- 233 Grove St
- 190 Crawford St
Your Personal Tour Guide
Ask me questions while you tour the home.