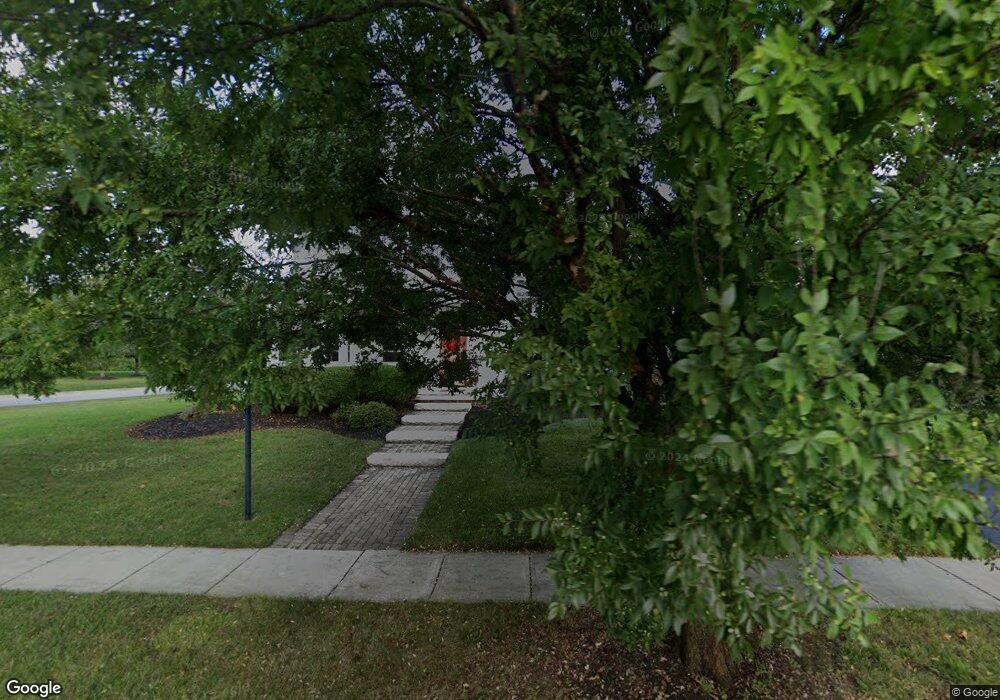
7546 Osimund Dr Unit 90 Columbus, OH 43235
Antrim NeighborhoodEstimated Value: $609,299 - $697,000
3
Beds
3
Baths
2,880
Sq Ft
$225/Sq Ft
Est. Value
About This Home
This home is located at 7546 Osimund Dr Unit 90, Columbus, OH 43235 and is currently estimated at $648,075, approximately $225 per square foot. 7546 Osimund Dr Unit 90 is a home located in Franklin County with nearby schools including Bluffsview Elementary School, McCord Middle School, and Worthington Kilbourne High School.
Ownership History
Date
Name
Owned For
Owner Type
Purchase Details
Closed on
Mar 22, 2012
Sold by
Sanabria Daniel and Torrealba Ysidora
Bought by
Shaw Michael and Curovac Sabina
Current Estimated Value
Home Financials for this Owner
Home Financials are based on the most recent Mortgage that was taken out on this home.
Original Mortgage
$318,250
Outstanding Balance
$218,720
Interest Rate
3.88%
Mortgage Type
New Conventional
Estimated Equity
$429,355
Purchase Details
Closed on
Mar 20, 2009
Sold by
M/I Homes Of Central Ohio Llc
Bought by
Sanabria Daniel and Torrealba Ysidro
Home Financials for this Owner
Home Financials are based on the most recent Mortgage that was taken out on this home.
Original Mortgage
$316,125
Interest Rate
5.22%
Mortgage Type
FHA
Create a Home Valuation Report for This Property
The Home Valuation Report is an in-depth analysis detailing your home's value as well as a comparison with similar homes in the area
Home Values in the Area
Average Home Value in this Area
Purchase History
| Date | Buyer | Sale Price | Title Company |
|---|---|---|---|
| Shaw Michael | $335,000 | Bxquality Cho | |
| Sanabria Daniel | $334,800 | Transohio |
Source: Public Records
Mortgage History
| Date | Status | Borrower | Loan Amount |
|---|---|---|---|
| Open | Shaw Michael | $318,250 | |
| Closed | Sanabria Daniel | $316,125 |
Source: Public Records
Tax History Compared to Growth
Tax History
| Year | Tax Paid | Tax Assessment Tax Assessment Total Assessment is a certain percentage of the fair market value that is determined by local assessors to be the total taxable value of land and additions on the property. | Land | Improvement |
|---|---|---|---|---|
| 2024 | $10,510 | $171,190 | $52,500 | $118,690 |
| 2023 | $10,050 | $171,185 | $52,500 | $118,685 |
| 2022 | $11,770 | $159,080 | $36,230 | $122,850 |
| 2021 | $10,859 | $159,080 | $36,230 | $122,850 |
| 2020 | $10,459 | $159,080 | $36,230 | $122,850 |
| 2019 | $10,033 | $137,690 | $31,500 | $106,190 |
| 2018 | $8,912 | $137,690 | $31,500 | $106,190 |
| 2017 | $8,547 | $137,690 | $31,500 | $106,190 |
| 2016 | $8,104 | $114,140 | $21,280 | $92,860 |
| 2015 | $8,105 | $114,140 | $21,280 | $92,860 |
| 2014 | $8,102 | $114,140 | $21,280 | $92,860 |
| 2013 | $3,665 | $103,775 | $19,355 | $84,420 |
Source: Public Records
Map
Nearby Homes
- 1109 Bluffway Dr
- 1101 Bluffway Dr
- 7522 Acela St
- 1232 Lochcarren Ct
- 1380 Tiehack Ct
- 1041 Rosebank Dr
- 7347 Fall Creek Ln Unit J
- 7187 Lorine Ct
- 7164 Durness Place
- 1620 Park Row Dr Unit A
- 941 Clubview Blvd S
- 865 Colony Way
- 1678 Park Row Dr Unit B
- 1721 Worthington Run Dr Unit 1721-1731
- 7383 Coldstream Dr
- 835 Clubview Blvd N
- 6908 Perry Dr
- 1672 Rushing Way
- 1813 Worthington Run Dr Unit A
- 1825 Watertower Dr Unit 1825
- 7546 Osimund Dr
- 7534 Osimund Dr
- 1153 Bluffway Dr
- 1113 Bluffway Dr
- 1152 Tessier Dr
- 7526 Osimund Dr
- 1111 Bluffway Dr
- 1161 Bluffway Dr
- 1160 Tessier Dr
- 1107 Bluffway Dr
- 7520 Varick St
- 1143 Tessier Dr
- 1105 Bluffway Dr
- 1169 Bluffway Dr
- 7518 Varick St
- 1151 Tessier Dr
- 1103 Bluffway Dr
- 1168 Tessier Dr
- 7516 Varick St
- 1159 Tessier Dr