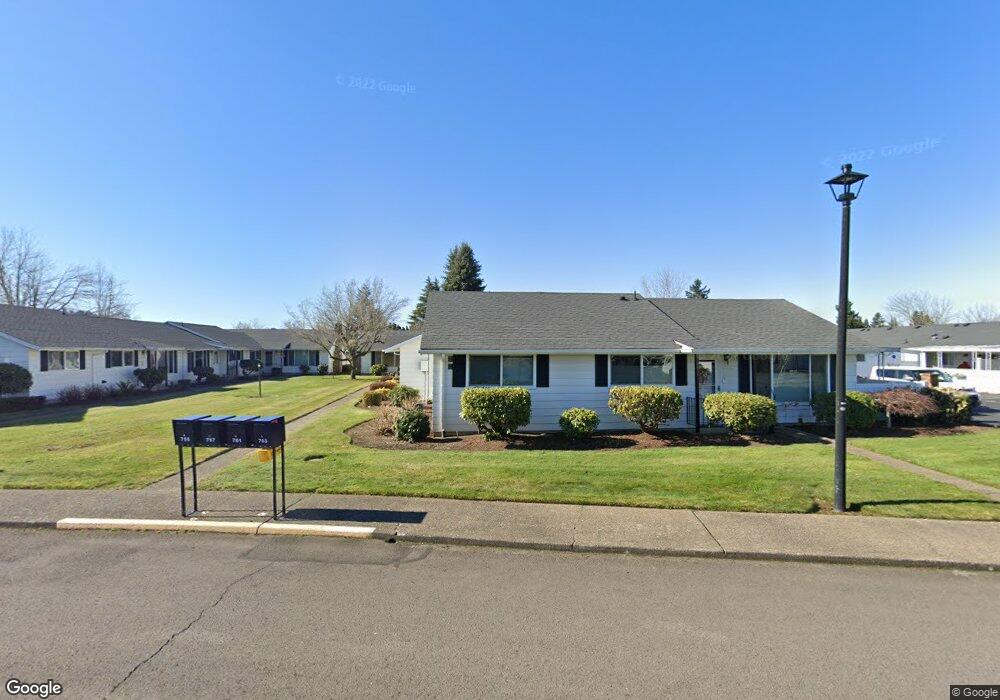
755 NE Fleming Ave Unit B18 Gresham, OR 97030
Powell Valley NeighborhoodEstimated Value: $221,000 - $229,085
2
Beds
1
Bath
962
Sq Ft
$233/Sq Ft
Est. Value
About This Home
This home is located at 755 NE Fleming Ave Unit B18, Gresham, OR 97030 and is currently estimated at $224,521, approximately $233 per square foot. 755 NE Fleming Ave Unit B18 is a home located in Multnomah County with nearby schools including Hall Elementary School, Gordon Russell Middle School, and Sam Barlow High School.
Ownership History
Date
Name
Owned For
Owner Type
Purchase Details
Closed on
Jul 3, 2024
Sold by
Cooley Partners Llc
Bought by
Anderson Linda K
Current Estimated Value
Purchase Details
Closed on
Nov 28, 2012
Sold by
Thio Linda J
Bought by
Anderson Linda K
Home Financials for this Owner
Home Financials are based on the most recent Mortgage that was taken out on this home.
Original Mortgage
$63,750
Interest Rate
3.33%
Mortgage Type
New Conventional
Purchase Details
Closed on
Apr 4, 2005
Sold by
Peters Esther
Bought by
Thio Linda J
Home Financials for this Owner
Home Financials are based on the most recent Mortgage that was taken out on this home.
Original Mortgage
$77,600
Interest Rate
5.6%
Mortgage Type
Purchase Money Mortgage
Purchase Details
Closed on
Feb 16, 1995
Sold by
Peters Esther
Bought by
Peters Esther and Esther Peters Revocable Living Trust
Create a Home Valuation Report for This Property
The Home Valuation Report is an in-depth analysis detailing your home's value as well as a comparison with similar homes in the area
Home Values in the Area
Average Home Value in this Area
Purchase History
| Date | Buyer | Sale Price | Title Company |
|---|---|---|---|
| Anderson Linda K | $50,213 | First American Title | |
| Anderson Linda K | $89,900 | First American | |
| Thio Linda J | $97,000 | First American | |
| Peters Esther | -- | -- |
Source: Public Records
Mortgage History
| Date | Status | Borrower | Loan Amount |
|---|---|---|---|
| Previous Owner | Anderson Linda K | $63,750 | |
| Previous Owner | Thio Linda J | $77,600 |
Source: Public Records
Tax History
| Year | Tax Paid | Tax Assessment Tax Assessment Total Assessment is a certain percentage of the fair market value that is determined by local assessors to be the total taxable value of land and additions on the property. | Land | Improvement |
|---|---|---|---|---|
| 2025 | $2,833 | $139,230 | -- | $139,230 |
| 2024 | $2,712 | $135,180 | -- | $135,180 |
| 2023 | $2,471 | $131,250 | $0 | $131,250 |
| 2022 | $2,402 | $127,430 | $0 | $0 |
| 2021 | $2,342 | $123,720 | $0 | $0 |
| 2020 | $2,203 | $120,120 | $0 | $0 |
| 2019 | $2,146 | $116,630 | $0 | $0 |
| 2018 | $2,046 | $113,240 | $0 | $0 |
| 2017 | $1,963 | $109,950 | $0 | $0 |
| 2016 | $1,731 | $106,750 | $0 | $0 |
Source: Public Records
Map
Nearby Homes
- 579 NE Fleming Ave Unit C41
- 820 NE Cochran Ave
- 2632 NE 7th Ct
- 900 NE Francis Ave Unit 29
- 900 NE Francis Ave
- 900 NE Francis Ave Unit 63
- 2811 NE 6th St
- 445 NE Village Squire Ave Unit 4
- 361 NE Village Squire Ave Unit 4
- 1275 NE Country Club Ave
- 251 NE Village Squire Ave Unit 2
- 251 NE Village Squire Ave Unit 15
- 2980 NE Division St Unit 31
- 2980 NE Division St Unit 13
- 2980 NE Division St Unit 43
- 1350 NE Cochran Dr
- 0 SE 1st St
- 1302 NE Hogan Dr
- 1308 NE Hogan Dr Unit 166
- 2941 NE 13th St Unit 22
- 757 NE Fleming Ave Unit C17
- 753 NE Fleming Ave Unit B19
- 751 NE Fleming Ave Unit C20
- 2310 NE 8th St
- 761 NE Fleming Ave Unit C16
- 2325 NE 7th Ct
- 749 NE Fleming Ave Unit C21
- 763 NE Fleming Ave Unit C15
- 861 NE Fleming Ave Unit B11
- 745 NE Fleming Ave Unit C22
- 859 NE Fleming Ave Unit B12
- 2300 NE 8th St
- 857 NE Fleming Ave Unit B13
- 2285 NE 7th Ct
- 679 NE Fleming Ave Unit 25-C
- 679 NE Fleming Ave Unit C25
- 855 NE Fleming Ave Unit A14
- 681 NE Fleming Ave Unit C24
- 677 NE Fleming Ave Unit B26
- 683 NE Fleming Ave Unit C23
Your Personal Tour Guide
Ask me questions while you tour the home.