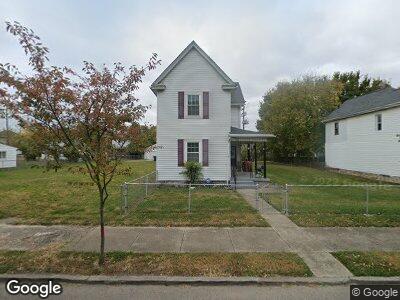
756 Campbell Ave Columbus, OH 43222
Franklinton NeighborhoodEstimated Value: $176,952 - $210,000
2
Beds
1
Bath
1,473
Sq Ft
$133/Sq Ft
Est. Value
About This Home
This home is located at 756 Campbell Ave, Columbus, OH 43222 and is currently estimated at $196,488, approximately $133 per square foot. 756 Campbell Ave is a home located in Franklin County with nearby schools including Sullivant Elementary School, Starling PK-8, and West High School.
Ownership History
Date
Name
Owned For
Owner Type
Purchase Details
Closed on
Mar 15, 2012
Sold by
Badgeley Robert J
Bought by
Badgeley Robert J and Robert J Badgeley Revocable Li
Current Estimated Value
Purchase Details
Closed on
Jan 29, 2008
Sold by
Jmf Properties
Bought by
Badgeley Robert J
Purchase Details
Closed on
May 15, 2007
Sold by
Hud
Bought by
Jmf Properties
Home Financials for this Owner
Home Financials are based on the most recent Mortgage that was taken out on this home.
Original Mortgage
$40,070
Interest Rate
6.22%
Mortgage Type
Purchase Money Mortgage
Purchase Details
Closed on
Jun 21, 2006
Sold by
Duff Roberta E and Wells Fargo Bank Na
Bought by
Hud
Purchase Details
Closed on
Aug 29, 1995
Sold by
Donna J Bowers Trst
Bought by
Roberta E Duff
Home Financials for this Owner
Home Financials are based on the most recent Mortgage that was taken out on this home.
Original Mortgage
$39,750
Interest Rate
7.43%
Mortgage Type
FHA
Purchase Details
Closed on
Aug 1, 1983
Create a Home Valuation Report for This Property
The Home Valuation Report is an in-depth analysis detailing your home's value as well as a comparison with similar homes in the area
Home Values in the Area
Average Home Value in this Area
Purchase History
| Date | Buyer | Sale Price | Title Company |
|---|---|---|---|
| Badgeley Robert J | -- | None Available | |
| Badgeley Robert J | $22,000 | Talon Group | |
| Jmf Properties | $23,070 | Lakeside Ti | |
| Hud | $28,000 | None Available | |
| Roberta E Duff | $39,900 | -- | |
| -- | -- | -- |
Source: Public Records
Mortgage History
| Date | Status | Borrower | Loan Amount |
|---|---|---|---|
| Previous Owner | Jmf Properties | $40,070 | |
| Previous Owner | Roberta E Duff | $39,750 |
Source: Public Records
Tax History Compared to Growth
Tax History
| Year | Tax Paid | Tax Assessment Tax Assessment Total Assessment is a certain percentage of the fair market value that is determined by local assessors to be the total taxable value of land and additions on the property. | Land | Improvement |
|---|---|---|---|---|
| 2024 | $3,038 | $66,300 | $15,860 | $50,440 |
| 2023 | $3,000 | $66,300 | $15,860 | $50,440 |
| 2022 | $1,343 | $25,270 | $2,170 | $23,100 |
| 2021 | $1,345 | $25,270 | $2,170 | $23,100 |
| 2020 | $1,347 | $25,270 | $2,170 | $23,100 |
| 2019 | $1,310 | $21,070 | $1,820 | $19,250 |
| 2018 | $1,027 | $21,070 | $1,820 | $19,250 |
| 2017 | $1,064 | $21,070 | $1,820 | $19,250 |
| 2016 | $819 | $12,050 | $2,070 | $9,980 |
| 2015 | $745 | $12,050 | $2,070 | $9,980 |
| 2014 | $747 | $12,050 | $2,070 | $9,980 |
| 2013 | $409 | $13,370 | $2,275 | $11,095 |
Source: Public Records
Map
Nearby Homes
- 775 Bellows Ave Unit 777
- 800 Campbell Ave
- 818 Bellows Ave
- 863 Campbell Ave
- 0 Bellows Ave
- 901 Campbell Ave
- 870-872 Sullivant Ave
- 339 Avondale Ave
- 286 Avondale Ave
- 273 Avondale Ave
- 1043 Bellows Ave
- 83 S Grubb St
- 308 S Cypress Ave
- 502 W Town St
- 49 S Hartford Ave
- 45 S Hartford Ave
- 41 S Hartford Ave
- 278 S Glenwood Ave
- 185 S Cypress Ave
- 374 S Yale Ave
- 756 Campbell Ave
- 760 Campbell Ave
- 748 Campbell Ave
- 744 Campbell Ave
- 740 Campbell Ave
- 768 Campbell Ave
- 757 Bellows Ave
- 759 Bellows Ave
- 747 Bellows Ave Unit 749
- 776 Campbell Ave
- 745 Bellows Ave
- 755 Campbell Ave
- 751 Campbell Ave
- 773 Bellows Ave
- 759 Campbell Ave
- 747-749 Bellows Ave Unit 747
- 747-749 Bellows Ave Unit 749
- 747-749 Bellows Ave
- 765 Campbell Ave
- 741 Bellows Ave