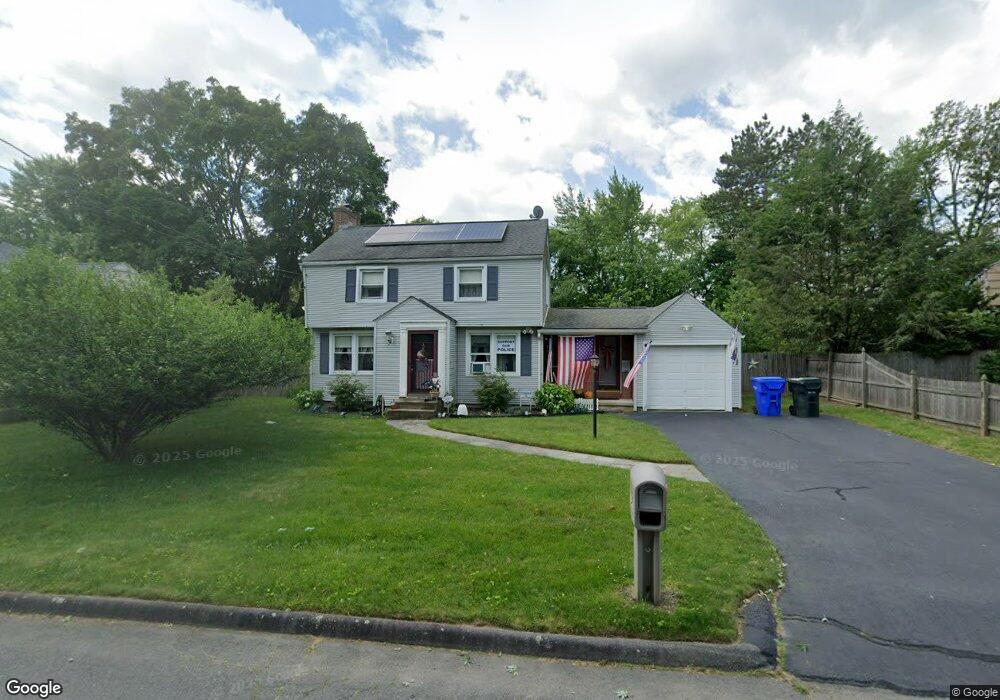
76 Fenway Dr Springfield, MA 01119
Sixteen Acres NeighborhoodEstimated Value: $303,000 - $373,000
3
Beds
2
Baths
1,284
Sq Ft
$258/Sq Ft
Est. Value
About This Home
This home is located at 76 Fenway Dr, Springfield, MA 01119 and is currently estimated at $331,723, approximately $258 per square foot. 76 Fenway Dr is a home located in Hampden County with nearby schools including Glickman Elementary, John J Duggan Middle, and Springfield High School of Science and Technology.
Ownership History
Date
Name
Owned For
Owner Type
Purchase Details
Closed on
Jun 30, 2009
Sold by
Smith Ronald L and Smith Donna M
Bought by
Smith Ronald L
Current Estimated Value
Home Financials for this Owner
Home Financials are based on the most recent Mortgage that was taken out on this home.
Original Mortgage
$62,000
Outstanding Balance
$39,656
Interest Rate
4.92%
Mortgage Type
Purchase Money Mortgage
Estimated Equity
$292,067
Purchase Details
Closed on
Jun 28, 1999
Sold by
Noreen David J and Noreen Maura F
Bought by
Smith Ronald L and Smith Donna M
Home Financials for this Owner
Home Financials are based on the most recent Mortgage that was taken out on this home.
Original Mortgage
$60,000
Interest Rate
7.09%
Mortgage Type
Purchase Money Mortgage
Purchase Details
Closed on
Jul 16, 1991
Sold by
Harrington Roberta E
Bought by
Noreen David J and Noreen Maura F
Home Financials for this Owner
Home Financials are based on the most recent Mortgage that was taken out on this home.
Original Mortgage
$111,221
Interest Rate
9.35%
Mortgage Type
Purchase Money Mortgage
Create a Home Valuation Report for This Property
The Home Valuation Report is an in-depth analysis detailing your home's value as well as a comparison with similar homes in the area
Home Values in the Area
Average Home Value in this Area
Purchase History
| Date | Buyer | Sale Price | Title Company |
|---|---|---|---|
| Smith Ronald L | -- | -- | |
| Smith Ronald L | $107,500 | -- | |
| Noreen David J | $110,000 | -- |
Source: Public Records
Mortgage History
| Date | Status | Borrower | Loan Amount |
|---|---|---|---|
| Open | Smith Ronald L | $62,000 | |
| Previous Owner | Noreen David J | $60,000 | |
| Previous Owner | Noreen David J | $111,221 | |
| Previous Owner | Noreen David J | $61,000 |
Source: Public Records
Tax History
| Year | Tax Paid | Tax Assessment Tax Assessment Total Assessment is a certain percentage of the fair market value that is determined by local assessors to be the total taxable value of land and additions on the property. | Land | Improvement |
|---|---|---|---|---|
| 2025 | $4,209 | $268,400 | $52,500 | $215,900 |
| 2024 | $4,294 | $267,400 | $52,500 | $214,900 |
| 2023 | $4,121 | $241,700 | $50,000 | $191,700 |
| 2022 | $4,005 | $212,800 | $50,000 | $162,800 |
| 2021 | $3,822 | $202,200 | $45,500 | $156,700 |
| 2020 | $3,459 | $177,100 | $45,500 | $131,600 |
| 2019 | $3,346 | $170,000 | $45,500 | $124,500 |
| 2018 | $3,365 | $171,000 | $45,500 | $125,500 |
| 2017 | $3,321 | $168,900 | $45,400 | $123,500 |
| 2016 | $3,560 | $181,100 | $45,400 | $135,700 |
| 2015 | $3,204 | $162,900 | $45,400 | $117,500 |
Source: Public Records
Map
Nearby Homes
- 53 Pidgeon Dr
- Lot 37 Kane St
- 38 Northway Dr
- 235 Starling Rd
- 186 Bolton St
- 39 Groton St
- 854 Grayson Dr
- 56 Rosemary Dr
- 121 Mallowhill Rd
- 130 Spear Rd
- 19 Annies Way
- 244 Nassau Dr Unit 244
- 25 Nassau Dr Unit 25
- 72 Nassau Dr
- 173 Nassau Dr
- 322 Gilbert Ave
- 15 Kingoke Ln
- 88 Senator St
- 239 Gresham St
- 297 Breckwood Blvd
Your Personal Tour Guide
Ask me questions while you tour the home.