
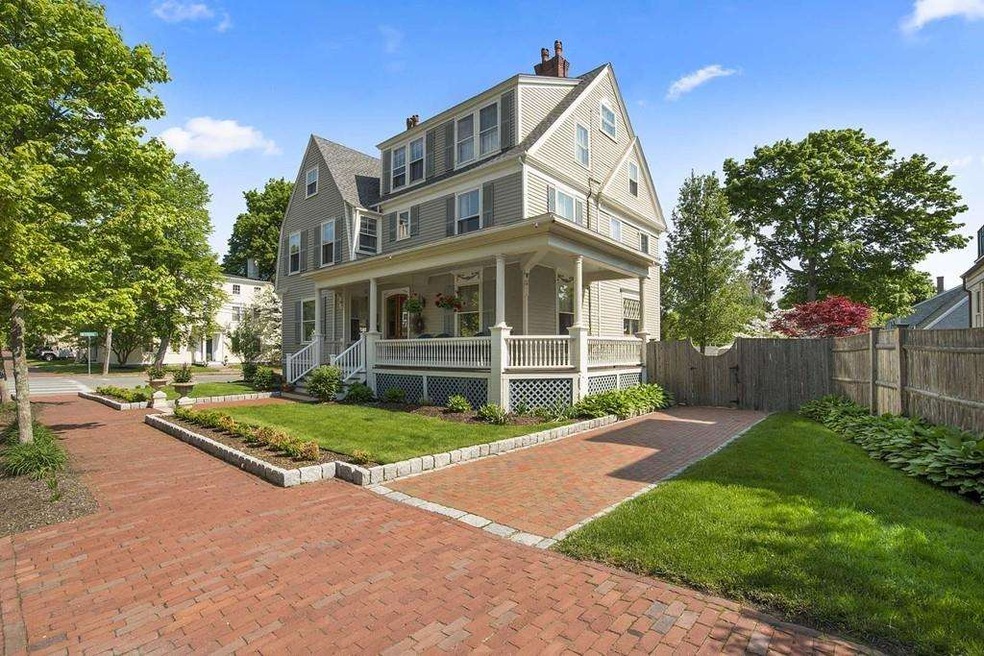
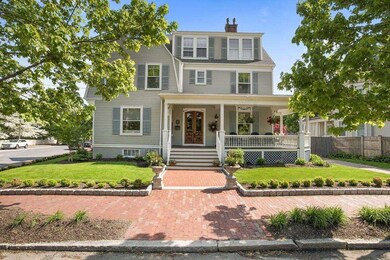

76 High St Newburyport, MA 01950
South End Neighborhood
6
Beds
5
Baths
4,031
Sq Ft
5,663
Sq Ft Lot
About This Home
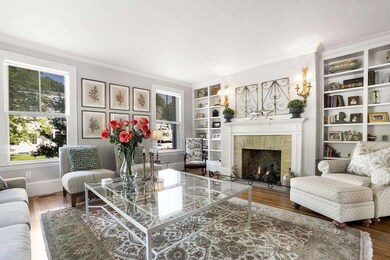
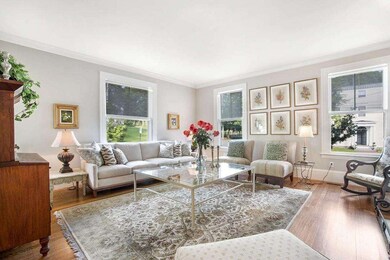
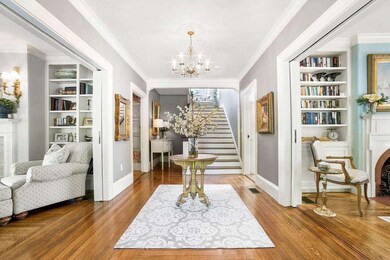
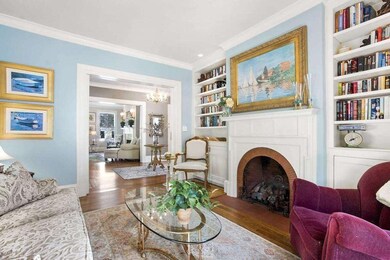
As of May 2025Live the in-town Newburyport lifestyle! Located at the corner of prestigious Federal & High Street, is this extensively renovated classic! The spacious floor plan allows for elegant entertaining with a walk out rear deck, bluestone patio, wrap around porch and private fenced garden and yard. There are beautifully refinished floors throughout, a restored grand foyer with bridal staircase, mitre cut double crown moldings, 4 of the 5 fireplaces have been converted to gas while preserving the decorative period mantels. Coffered ceiling in the master suite with attached sunny dressing room and bath. Designated on the tax assessors record as a 2 family there is a tranquil in law/ au pair living area with its own private access. Steps to the Tannery, Sunday Farmer's Market, and all vibrant downtown has to offer, easy access to the beach and the bike trail to the train station for Boston. Parking for 4 cars. Make this in-town home your New England seaside retreat. New Roof 2015
Last Agent to Sell the Property
Gibson Sotheby's International Realty Listed on: 05/29/2018
Home Details
Home Type
- Single Family
Est. Annual Taxes
- $15,485
Year Built
- Built in 1879
Lot Details
- Year Round Access
Utilities
- Central Heating and Cooling System
- Window Unit Cooling System
- Heating System Uses Oil
Additional Features
- Basement
Listing and Financial Details
- Assessor Parcel Number M:0018 B:0080 L:0000
Ownership History
Date
Name
Owned For
Owner Type
Purchase Details
Listed on
Mar 17, 2025
Closed on
May 28, 2025
Sold by
Pratt Andrew and Pratt Lisa
Bought by
Grinnell Grace and Perlow Matthew
Seller's Agent
Andrea O'Reilly
Keller Williams Realty Evolution
Buyer's Agent
Team Harborside
Sagan Harborside Sotheby's International Realty
List Price
$2,194,000
Sold Price
$1,995,000
Premium/Discount to List
-$199,000
-9.07%
Views
151
Home Financials for this Owner
Home Financials are based on the most recent Mortgage that was taken out on this home.
Avg. Annual Appreciation
-8.50%
Original Mortgage
$1,245,000
Outstanding Balance
$1,243,504
Interest Rate
5%
Mortgage Type
Purchase Money Mortgage
Estimated Equity
$732,101
Purchase Details
Closed on
May 20, 2003
Sold by
Teicher Robert D
Bought by
Bensley Peter and Bensley Lianne Williams
Home Financials for this Owner
Home Financials are based on the most recent Mortgage that was taken out on this home.
Original Mortgage
$310,000
Interest Rate
5.84%
Mortgage Type
Purchase Money Mortgage
Purchase Details
Closed on
May 4, 1988
Sold by
Frangipane Albert
Bought by
Teicher Robert D
Similar Homes in the area
Create a Home Valuation Report for This Property
The Home Valuation Report is an in-depth analysis detailing your home's value as well as a comparison with similar homes in the area
Home Values in the Area
Average Home Value in this Area
Purchase History
| Date | Type | Sale Price | Title Company |
|---|---|---|---|
| Deed | $1,995,000 | None Available | |
| Deed | $1,995,000 | None Available | |
| Deed | $665,000 | -- | |
| Deed | -- | -- | |
| Deed | $665,000 | -- | |
| Deed | $329,900 | -- |
Source: Public Records
Mortgage History
| Date | Status | Loan Amount | Loan Type |
|---|---|---|---|
| Open | $1,245,000 | Purchase Money Mortgage | |
| Closed | $1,245,000 | Purchase Money Mortgage | |
| Previous Owner | $367,807 | Credit Line Revolving | |
| Previous Owner | $845,000 | Stand Alone Refi Refinance Of Original Loan | |
| Previous Owner | $860,000 | Stand Alone Refi Refinance Of Original Loan | |
| Previous Owner | $875,000 | Purchase Money Mortgage | |
| Previous Owner | $100,000 | New Conventional | |
| Previous Owner | $310,000 | Purchase Money Mortgage |
Source: Public Records
Property History
| Date | Event | Price | Change | Sq Ft Price |
|---|---|---|---|---|
| 05/28/2025 05/28/25 | Sold | $1,995,000 | -0.2% | $475 / Sq Ft |
| 05/01/2025 05/01/25 | Pending | -- | -- | -- |
| 04/21/2025 04/21/25 | Price Changed | $1,999,000 | -4.8% | $476 / Sq Ft |
| 04/10/2025 04/10/25 | Price Changed | $2,099,000 | -2.3% | $500 / Sq Ft |
| 04/01/2025 04/01/25 | Price Changed | $2,149,000 | -2.1% | $512 / Sq Ft |
| 03/17/2025 03/17/25 | For Sale | $2,194,000 | +75.5% | $522 / Sq Ft |
| 08/03/2018 08/03/18 | Sold | $1,250,000 | -3.5% | $310 / Sq Ft |
| 06/17/2018 06/17/18 | Pending | -- | -- | -- |
| 05/29/2018 05/29/18 | For Sale | $1,295,000 | +53.3% | $321 / Sq Ft |
| 06/17/2015 06/17/15 | Sold | $845,000 | -3.4% | $218 / Sq Ft |
| 02/05/2015 02/05/15 | Pending | -- | -- | -- |
| 10/09/2014 10/09/14 | For Sale | $875,000 | -- | $226 / Sq Ft |
Source: MLS Property Information Network (MLS PIN)
Tax History Compared to Growth
Tax History
| Year | Tax Paid | Tax Assessment Tax Assessment Total Assessment is a certain percentage of the fair market value that is determined by local assessors to be the total taxable value of land and additions on the property. | Land | Improvement |
|---|---|---|---|---|
| 2025 | $15,485 | $1,616,400 | $462,800 | $1,153,600 |
| 2024 | $14,994 | $1,503,900 | $420,800 | $1,083,100 |
| 2023 | $19,507 | $1,816,300 | $365,900 | $1,450,400 |
| 2022 | $14,342 | $1,194,200 | $304,900 | $889,300 |
| 2021 | $13,776 | $1,089,900 | $277,200 | $812,700 |
| 2020 | $13,351 | $1,039,800 | $277,200 | $762,600 |
| 2019 | $11,962 | $914,500 | $277,200 | $637,300 |
| 2018 | $11,819 | $891,300 | $264,000 | $627,300 |
| 2017 | $10,673 | $793,500 | $251,400 | $542,100 |
| 2016 | $9,468 | $707,100 | $239,500 | $467,600 |
| 2015 | -- | $655,200 | $239,500 | $415,700 |
Source: Public Records
Agents Affiliated with this Home
-
Andrea O'Reilly
Seller's Agent in 2025
Andrea O'Reilly
Keller Williams Realty Evolution
(617) 827-0532
5 in this area
171 Total Sales
-
Team Harborside
T
Buyer's Agent in 2025
Team Harborside
Sagan Harborside Sotheby's International Realty
(617) 816-1909
1 in this area
140 Total Sales
-
Tom Kennedy
Seller's Agent in 2018
Tom Kennedy
Gibson Sothebys International Realty
(617) 947-9201
2 in this area
31 Total Sales
-
John Wells
Buyer's Agent in 2015
John Wells
Wellsco Realty Partners
(603) 732-1800
5 in this area
28 Total Sales
Map
Source: MLS Property Information Network (MLS PIN)
MLS Number: 72335017
APN: NEWP-000018-000080
Disclaimer: Certain information contained herein is derived from information provided by parties other than Homes.com. All information provided is deemed reliable, but is not guaranteed to be accurate and should be independently verified.
![]() The property listing data and information, or the Images, set forth herein were provided to MLS Property Information Network, Inc. from third party sources, including sellers, lessors and public records, and were compiled by MLS Property Information Network, Inc. The property listing data and information, and the Images, are for the personal, non-commercial use of consumers having a good faith interest in purchasing or leasing listed properties of the type displayed to them and may not be used for any purpose other than to identify prospective properties which such consumers may have a good faith interest in purchasing or leasing. MLS Property Information Network, Inc. and its subscribers disclaim any and all representations and warranties as to the accuracy of the property listing data and information, or as to the accuracy of any of the Images, set forth herein.
The property listing data and information, or the Images, set forth herein were provided to MLS Property Information Network, Inc. from third party sources, including sellers, lessors and public records, and were compiled by MLS Property Information Network, Inc. The property listing data and information, and the Images, are for the personal, non-commercial use of consumers having a good faith interest in purchasing or leasing listed properties of the type displayed to them and may not be used for any purpose other than to identify prospective properties which such consumers may have a good faith interest in purchasing or leasing. MLS Property Information Network, Inc. and its subscribers disclaim any and all representations and warranties as to the accuracy of the property listing data and information, or as to the accuracy of any of the Images, set forth herein.
Nearby Homes
- 51 High St
- 8 Parsons St
- 8 Parsons St Unit 8
- 10 B Milk St Unit 1
- 1 Fruit St
- 37 1/2 Federal St
- 6 Orange St Unit 7
- 95 High St Unit 4
- 42 Federal St Unit B
- 65 Bromfield St
- 141 State St Unit 2
- 19 Beck St
- 12 Lunt St
- 56 Middle St
- 132 High St Unit B
- 5-13 Lime St Unit 2
- 129 Water St
- 21 Hines Way Unit 21
- 5 High Rd
- 10 10th St