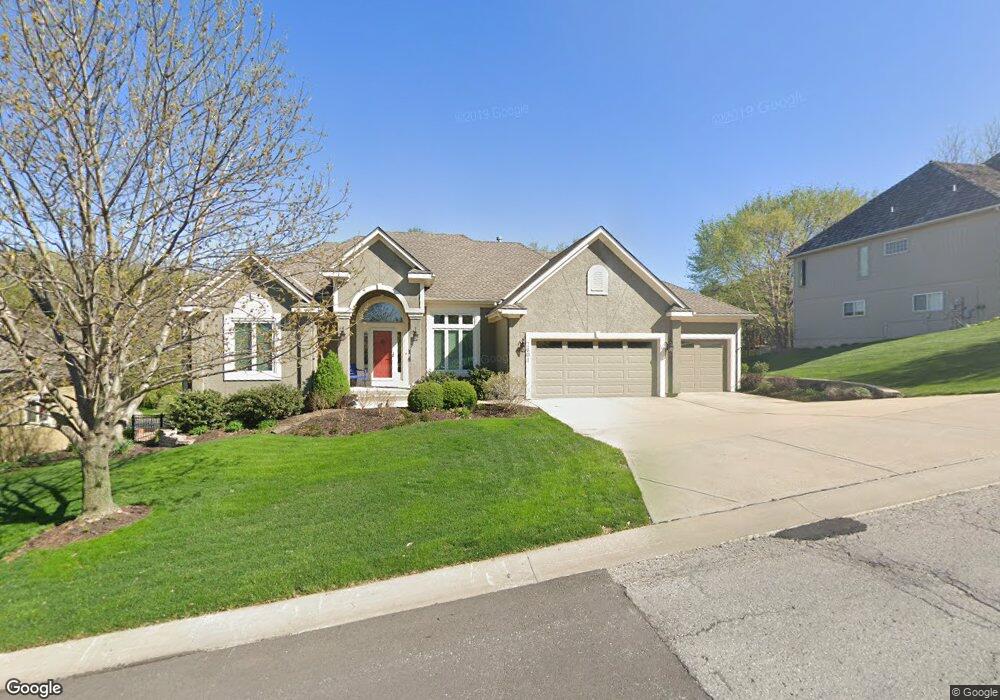
7601 Legler St Shawnee, KS 66217
Estimated Value: $568,000 - $687,000
5
Beds
4
Baths
2,210
Sq Ft
$278/Sq Ft
Est. Value
About This Home
This home is located at 7601 Legler St, Shawnee, KS 66217 and is currently estimated at $614,736, approximately $278 per square foot. 7601 Legler St is a home located in Johnson County with nearby schools including Christa McAuliffe Elementary School, Westridge Middle School, and Shawnee Mission West High School.
Ownership History
Date
Name
Owned For
Owner Type
Purchase Details
Closed on
Mar 30, 2022
Sold by
Kernes George B and Kernes Janet F
Bought by
Weaver Rocke and Weaver Joan F
Current Estimated Value
Purchase Details
Closed on
Jun 6, 2006
Sold by
Kafer Douglas R and Kafer Jyll S
Bought by
Kernes George B and Kernes Janet F
Home Financials for this Owner
Home Financials are based on the most recent Mortgage that was taken out on this home.
Original Mortgage
$250,000
Interest Rate
6.56%
Mortgage Type
New Conventional
Purchase Details
Closed on
Jun 24, 2002
Sold by
Hopkins Homes Inc
Bought by
Kafer Douglas R and Kafer Jyll S
Home Financials for this Owner
Home Financials are based on the most recent Mortgage that was taken out on this home.
Original Mortgage
$270,350
Interest Rate
6.89%
Create a Home Valuation Report for This Property
The Home Valuation Report is an in-depth analysis detailing your home's value as well as a comparison with similar homes in the area
Home Values in the Area
Average Home Value in this Area
Purchase History
| Date | Buyer | Sale Price | Title Company |
|---|---|---|---|
| Weaver Rocke | -- | New Title Company Name | |
| Kernes George B | -- | Chicago Title Ins Co | |
| Kafer Douglas R | -- | Mid America Title Company In |
Source: Public Records
Mortgage History
| Date | Status | Borrower | Loan Amount |
|---|---|---|---|
| Previous Owner | Kernes George B | $250,000 | |
| Previous Owner | Kafer Douglas R | $270,350 |
Source: Public Records
Tax History Compared to Growth
Tax History
| Year | Tax Paid | Tax Assessment Tax Assessment Total Assessment is a certain percentage of the fair market value that is determined by local assessors to be the total taxable value of land and additions on the property. | Land | Improvement |
|---|---|---|---|---|
| 2024 | $7,099 | $66,459 | $12,448 | $54,011 |
| 2023 | $6,922 | $64,400 | $11,319 | $53,081 |
| 2022 | $6,146 | $57,005 | $11,319 | $45,686 |
| 2021 | $6,083 | $53,199 | $11,319 | $41,880 |
| 2020 | $5,930 | $51,186 | $10,290 | $40,896 |
| 2019 | $5,784 | $49,898 | $9,362 | $40,536 |
| 2018 | $5,635 | $48,427 | $8,507 | $39,920 |
| 2017 | $5,874 | $49,715 | $8,507 | $41,208 |
| 2016 | $5,777 | $48,277 | $8,507 | $39,770 |
| 2015 | $5,360 | $46,230 | $8,507 | $37,723 |
| 2013 | -- | $43,631 | $8,507 | $35,124 |
Source: Public Records
Map
Nearby Homes
- 7621 Lichtenauer Dr
- 7219 Allman Rd
- 7239 Allman Rd
- 7221 Allman Rd
- 7237 Allman Rd
- 7231 Allman Rd
- 7229 Allman Dr
- 16128 Midland Dr
- 8033 Hall St
- 15615 W 81st St
- 7325 Oakview St
- 6964 Renner Rd
- 15322 W 83rd St
- 6942 Constance St
- 15529 W 83rd Terrace
- 16809 W 83rd St
- 15322 W 83rd Terrace
- 15710 W 84th Terrace
- 14828 W 83rd Place
- 8403 Swarner Dr
- 7605 Legler St
- 7593 Legler St
- 7608 Schweiger St
- 7603 Schweiger St
- 7597 Schweiger St
- 7600 Legler St
- 7594 Legler St
- 7607 Schweiger St
- 7614 Schweiger St
- 7593 Schweiger St
- 7604 Legler St
- 7590 Legler St
- 7611 Schweiger St
- 7613 Legler St
- 7587 Legler St
- 7608 Legler St
- 7609 Lichtenauer Dr
- 7619 Schweiger St
- 7586 Legler St
- 7575 Lichtenauer Dr