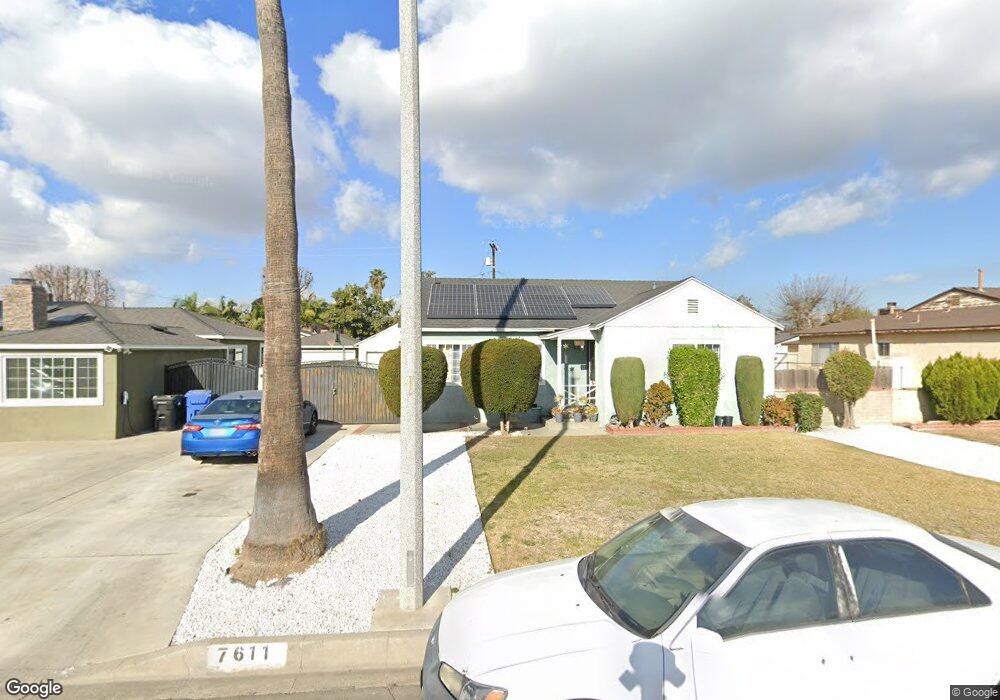
7611 Cedarcliff Ave Whittier, CA 90606
West Whittier-Los Nietos NeighborhoodEstimated Value: $751,580 - $791,000
3
Beds
1
Bath
1,169
Sq Ft
$656/Sq Ft
Est. Value
About This Home
This home is located at 7611 Cedarcliff Ave, Whittier, CA 90606 and is currently estimated at $766,645, approximately $655 per square foot. 7611 Cedarcliff Ave is a home located in Los Angeles County with nearby schools including Daniel Phelan Language Academy, Katherine Edwards Middle School, and Pioneer High School.
Ownership History
Date
Name
Owned For
Owner Type
Purchase Details
Closed on
May 22, 2001
Sold by
Betancourt David and Betancourt Rachel
Bought by
Henriquez Douglas
Current Estimated Value
Home Financials for this Owner
Home Financials are based on the most recent Mortgage that was taken out on this home.
Original Mortgage
$194,950
Interest Rate
7.15%
Purchase Details
Closed on
Jun 16, 1999
Sold by
Ayonn Francisco J and Ayonn Graciela Pena
Bought by
Betancourt David
Home Financials for this Owner
Home Financials are based on the most recent Mortgage that was taken out on this home.
Original Mortgage
$162,659
Interest Rate
7.64%
Mortgage Type
FHA
Purchase Details
Closed on
Dec 8, 1995
Sold by
Kempert Donald J
Bought by
Ayonn Francisco J and Ayonn Graciela Pena
Home Financials for this Owner
Home Financials are based on the most recent Mortgage that was taken out on this home.
Original Mortgage
$147,488
Interest Rate
7.05%
Mortgage Type
FHA
Create a Home Valuation Report for This Property
The Home Valuation Report is an in-depth analysis detailing your home's value as well as a comparison with similar homes in the area
Home Values in the Area
Average Home Value in this Area
Purchase History
| Date | Buyer | Sale Price | Title Company |
|---|---|---|---|
| Henriquez Douglas | $201,000 | Chicago Title Co | |
| Betancourt David | $164,000 | Chicago Title Insurance Co | |
| Ayonn Francisco J | $150,000 | Chicago Title |
Source: Public Records
Mortgage History
| Date | Status | Borrower | Loan Amount |
|---|---|---|---|
| Previous Owner | Henriquez Douglas | $194,950 | |
| Previous Owner | Betancourt David | $162,659 | |
| Previous Owner | Ayonn Francisco J | $147,488 |
Source: Public Records
Tax History
| Year | Tax Paid | Tax Assessment Tax Assessment Total Assessment is a certain percentage of the fair market value that is determined by local assessors to be the total taxable value of land and additions on the property. | Land | Improvement |
|---|---|---|---|---|
| 2025 | $3,805 | $296,914 | $202,675 | $94,239 |
| 2024 | $3,805 | $291,093 | $198,701 | $92,392 |
| 2023 | $3,736 | $285,386 | $194,805 | $90,581 |
| 2022 | $3,660 | $279,791 | $190,986 | $88,805 |
| 2021 | $3,583 | $274,306 | $187,242 | $87,064 |
| 2019 | $3,519 | $266,173 | $181,690 | $84,483 |
| 2018 | $3,403 | $260,955 | $178,128 | $82,827 |
| 2016 | $3,262 | $250,823 | $171,212 | $79,611 |
| 2015 | $3,195 | $247,057 | $168,641 | $78,416 |
| 2014 | $3,151 | $242,218 | $165,338 | $76,880 |
Source: Public Records
Map
Nearby Homes
- 11454 Aldrich St
- 7429 Kengard Ave
- 11783 E Melody Way
- 7409 Kengard Ave
- 7209 Lynalan Ave
- 11825 Washington Blvd Unit 51
- 7940 Appledale Ave
- 12128 Summer Ln
- 11643 Aeolian St
- 7720 Paul Dr
- 10934 Choisser St
- 12276 Starling Ln
- 12008 Turnleaf Ave
- 8348 Norwalk Blvd
- 7406 Norwalk Blvd
- 11730 Whittier Blvd Unit 63
- 11730 Whittier Blvd Unit 27
- 11730 Whittier Blvd Unit 39
- 11730 Whittier Blvd Unit 55
- 11730 Whittier Blvd Unit 54
- 7617 Cedarcliff Ave
- 11496 Dicky St
- 11486 Dicky St
- 7623 Cedarcliff Ave
- 7610 Westman Ave
- 7618 Westman Ave
- 7602 Westman Ave
- 7626 Westman Ave
- 7608 Cedarcliff Ave
- 7629 Cedarcliff Ave
- 11504 Dicky St
- 7614 Cedarcliff Ave
- 7634 Westman Ave
- 11497 Dicky St
- 11491 Dicky St
- 7620 Cedarcliff Ave
- 11485 Dicky St
- 7626 Cedarcliff Ave
- 7641 Cedarcliff Ave
- 11503 Dicky St
Your Personal Tour Guide
Ask me questions while you tour the home.