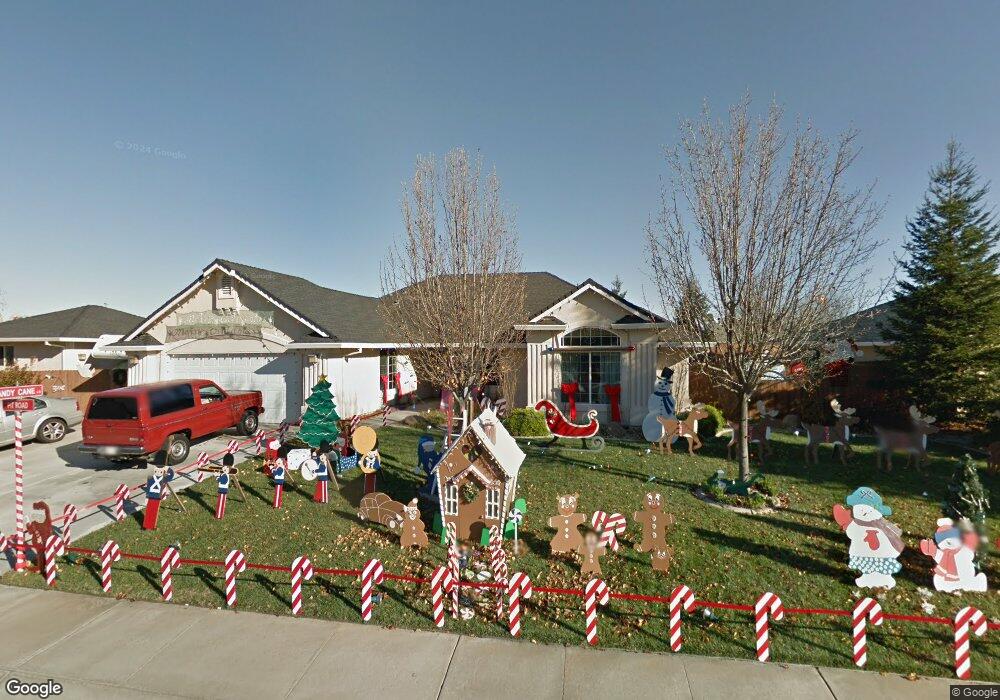
7621 Pit Rd Unit Lot 76 Redding, CA 96001
Girvan NeighborhoodEstimated Value: $461,000 - $493,000
3
Beds
2
Baths
1,968
Sq Ft
$243/Sq Ft
Est. Value
About This Home
This home is located at 7621 Pit Rd Unit Lot 76, Redding, CA 96001 and is currently estimated at $478,345, approximately $243 per square foot. 7621 Pit Rd Unit Lot 76 is a home located in Shasta County with nearby schools including Bonny View Elementary School, Sequoia Middle School, and Shasta High School.
Ownership History
Date
Name
Owned For
Owner Type
Purchase Details
Closed on
Mar 19, 2020
Sold by
Runciman John D
Bought by
Runciman John D and The Runciman Family Trust
Current Estimated Value
Purchase Details
Closed on
Aug 12, 2003
Sold by
Palomar Builders Inc
Bought by
Runciman John D and Runciman Denise A
Home Financials for this Owner
Home Financials are based on the most recent Mortgage that was taken out on this home.
Original Mortgage
$120,800
Outstanding Balance
$51,915
Interest Rate
5.29%
Mortgage Type
Purchase Money Mortgage
Estimated Equity
$426,430
Purchase Details
Closed on
Feb 26, 2003
Sold by
Crown Estates Llc
Bought by
Palomar Builders Inc
Create a Home Valuation Report for This Property
The Home Valuation Report is an in-depth analysis detailing your home's value as well as a comparison with similar homes in the area
Home Values in the Area
Average Home Value in this Area
Purchase History
| Date | Buyer | Sale Price | Title Company |
|---|---|---|---|
| Runciman John D | -- | None Available | |
| Runciman John D | $287,000 | Placer Title Company | |
| Palomar Builders Inc | $754,000 | Placer Title Company |
Source: Public Records
Mortgage History
| Date | Status | Borrower | Loan Amount |
|---|---|---|---|
| Open | Runciman John D | $120,800 |
Source: Public Records
Tax History
| Year | Tax Paid | Tax Assessment Tax Assessment Total Assessment is a certain percentage of the fair market value that is determined by local assessors to be the total taxable value of land and additions on the property. | Land | Improvement |
|---|---|---|---|---|
| 2025 | $4,488 | $442,131 | $83,626 | $358,505 |
| 2024 | $4,419 | $433,463 | $81,987 | $351,476 |
| 2023 | $4,419 | $424,965 | $80,380 | $344,585 |
| 2022 | $4,344 | $416,633 | $78,804 | $337,829 |
| 2021 | $4,178 | $395,000 | $60,000 | $335,000 |
| 2020 | $4,114 | $380,000 | $60,000 | $320,000 |
| 2019 | $3,876 | $370,000 | $70,000 | $300,000 |
| 2018 | $3,718 | $345,000 | $65,000 | $280,000 |
| 2017 | $3,495 | $320,000 | $70,000 | $250,000 |
| 2016 | $3,451 | $320,000 | $70,000 | $250,000 |
| 2015 | $3,404 | $315,000 | $70,000 | $245,000 |
| 2014 | $3,171 | $290,000 | $60,000 | $230,000 |
Source: Public Records
Map
Nearby Homes
- 7728 Pit Rd
- 7420 Platinum Way
- 7253 Legacy
- 7022 Marvin Trail
- 7060 Pit Rd
- 6955 Yvonne Ct
- 6871 Hemlock St
- 8641 Redbank Rd
- 3182 Island Dr
- 7252 Whitehouse Dr
- 7035 Riverside Dr
- 0 Waverly Manor
- 6958 Riverside Dr
- 6725 Reflection St
- 6733 El Camino Dr
- 6624 Southgate Dr
- 6551 El Camino Dr
- 6681 Riverside Dr
- 2890 Balaton Ave
- 2850 Balaton Ave
- 7621 Pit Rd
- 7639 Pit Rd Unit Lot 77
- 7639 Pit Rd
- 2617 Rhinestone Way Unit Lot 86
- 2617 Rhinestone Way
- 2633 Rhinestone Way Unit lot85
- 2633 Rhinestone Way
- 2603 Rhinestone Way Unit Lot 75
- 2603 Rhinestone Way
- 2649 Rhinestone Way Unit Lot 84
- 2649 Rhinestone Way
- 7630 Pit Rd Unit Lot 22
- 7630 Pit Rd
- 7642 Pit Rd Unit Lot 23
- 7642 Pit Rd
- 7657 Pit Off Platinum
- 7657 Pit Rd Unit Lot78
- 7657 Pit Rd
- 7618 Pit Rd Unit Lot21
- 7618 Pit Rd
Your Personal Tour Guide
Ask me questions while you tour the home.