Estimated Value: $196,000 - $248,000
3
Beds
2
Baths
1,536
Sq Ft
$142/Sq Ft
Est. Value
About This Home
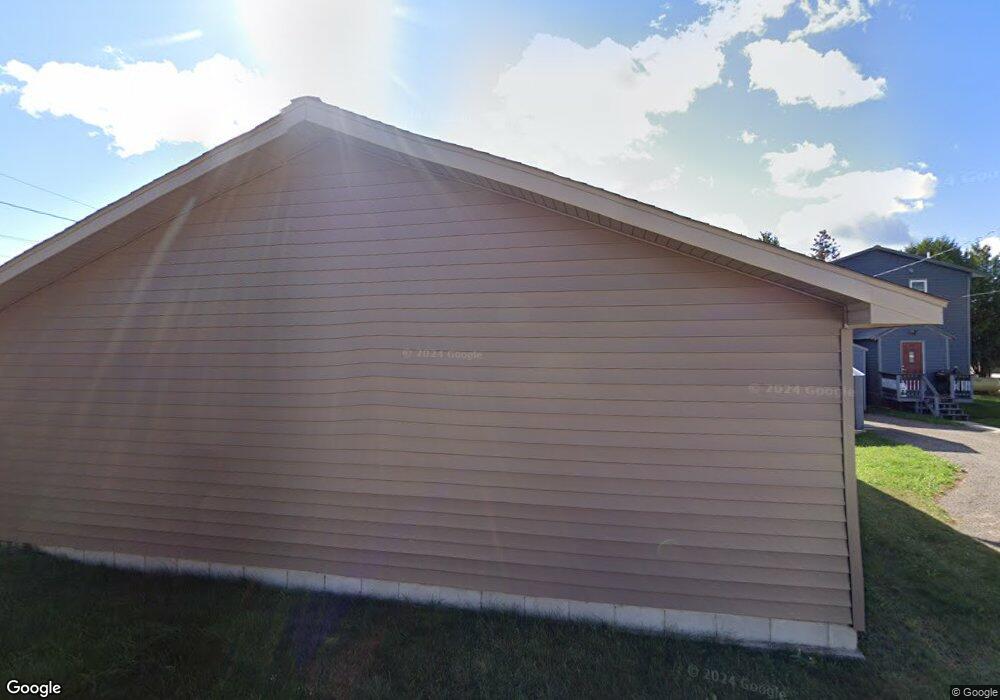
This home is located at 769 E Camp St, Ely, MN 55731 and is currently estimated at $218,847, approximately $142 per square foot. 769 E Camp St is a home located in St. Louis County with nearby schools including Washington Elementary School and Memorial High School.
Ownership History
Date
Name
Owned For
Owner Type
Purchase Details
Closed on
Jun 3, 2004
Sold by
Willett Joseph E and Willett Nicki
Bought by
Hren Scott L and Hren Amanda
Current Estimated Value
Home Financials for this Owner
Home Financials are based on the most recent Mortgage that was taken out on this home.
Original Mortgage
$99,700
Outstanding Balance
$49,877
Interest Rate
6.46%
Mortgage Type
Purchase Money Mortgage
Estimated Equity
$168,971
Purchase Details
Closed on
Mar 28, 2003
Sold by
Carlson Robert Allen
Bought by
Willett Joseph E
Home Financials for this Owner
Home Financials are based on the most recent Mortgage that was taken out on this home.
Original Mortgage
$113,106
Interest Rate
5.76%
Mortgage Type
FHA
Create a Home Valuation Report for This Property
The Home Valuation Report is an in-depth analysis detailing your home's value as well as a comparison with similar homes in the area
Home Values in the Area
Average Home Value in this Area
Purchase History
| Date | Buyer | Sale Price | Title Company |
|---|---|---|---|
| Hren Scott L | $105,000 | Northeast Title Company | |
| Willett Joseph E | $113,000 | Ati Title Company |
Source: Public Records
Mortgage History
| Date | Status | Borrower | Loan Amount |
|---|---|---|---|
| Open | Hren Scott L | $99,700 | |
| Previous Owner | Willett Joseph E | $113,106 |
Source: Public Records
Tax History
| Year | Tax Paid | Tax Assessment Tax Assessment Total Assessment is a certain percentage of the fair market value that is determined by local assessors to be the total taxable value of land and additions on the property. | Land | Improvement |
|---|---|---|---|---|
| 2024 | $2,568 | $207,600 | $14,800 | $192,800 |
| 2023 | $2,568 | $196,500 | $14,300 | $182,200 |
| 2022 | $2,570 | $163,800 | $13,600 | $150,200 |
| 2021 | $1,830 | $137,600 | $12,400 | $125,200 |
| 2020 | $1,634 | $123,400 | $12,400 | $111,000 |
| 2019 | $1,550 | $123,400 | $12,400 | $111,000 |
| 2018 | $1,498 | $121,600 | $12,400 | $109,200 |
| 2017 | $1,314 | $119,400 | $12,900 | $106,500 |
| 2016 | $1,426 | $105,500 | $11,700 | $93,800 |
| 2015 | $1,319 | $82,000 | $9,800 | $72,200 |
| 2014 | $1,319 | $82,000 | $9,800 | $72,200 |
Source: Public Records
Map
Nearby Homes
- 738 E Camp St
- 628 E Sheridan St
- 246 N 5th Ave E
- 1135 E Harvey St
- 1239 E Washington St
- 235 E Harvey St
- 324 S 4th Ave E
- 27 E Harvey St
- TBD Hill Top Rd
- 545 E Wilson St
- TBD Trezona Rd
- 23 W Harvey St
- 1317 N Pioneer Rd
- 52 W Chandler St
- 1471 N Pioneer Rd
- 1621 N Pioneer Rd
- 2221 Sibley Dr
- 2231 Sibley Dr
- 1530 N 20th Ave E
- TBD Johnson Creek Dr
- 757 E Camp St
- 745 E Camp St
- 766 E Madison St
- 758 E Madison St
- 731 E Camp St
- 746 E Camp St
- 742 E Madison St Unit 46
- 732 E Camp St
- 744 E Madison St
- 719 E Camp St
- 726 E Camp St
- 906 E Camp St
- 730 E Madison St
- 718 E Camp St
- 707 E Camp St
- 747 E Sheridan St
- 743 E Sheridan St
- 712 E Camp St
- 918 E Camp St
- 735 E Sheridan St
Your Personal Tour Guide
Ask me questions while you tour the home.