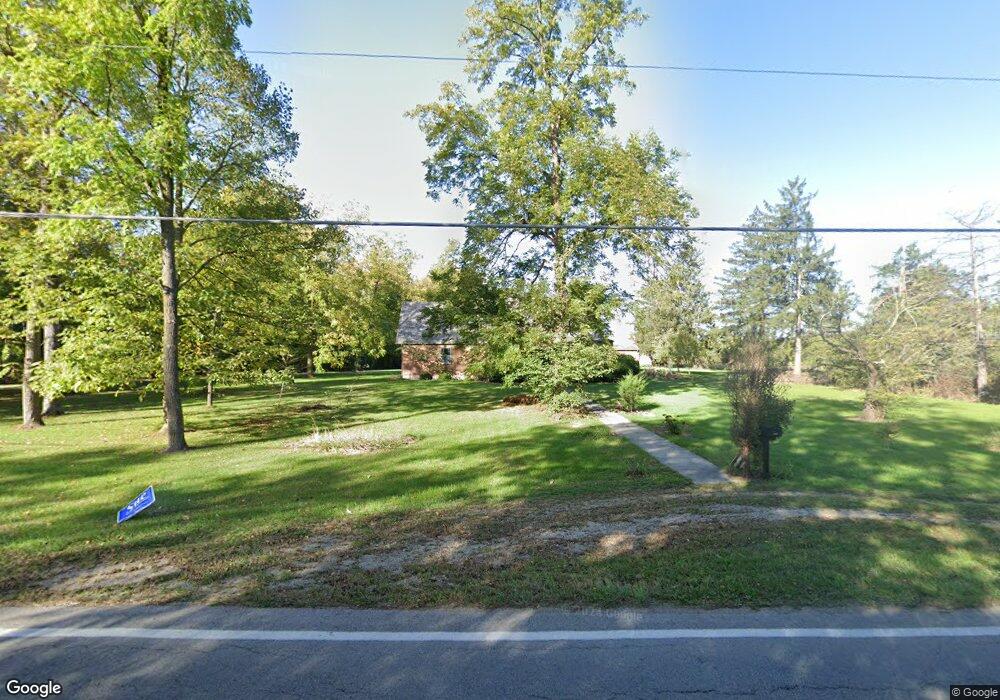
7717 N Walnut St Muncie, IN 47303
Estimated Value: $210,000 - $274,339
3
Beds
1
Bath
2,240
Sq Ft
$110/Sq Ft
Est. Value
About This Home
This home is located at 7717 N Walnut St, Muncie, IN 47303 and is currently estimated at $247,335, approximately $110 per square foot. 7717 N Walnut St is a home located in Delaware County with nearby schools including Royerton Elementary School, Delta Middle School, and Delta High School.
Ownership History
Date
Name
Owned For
Owner Type
Purchase Details
Closed on
Sep 26, 2022
Sold by
Mccrory Adam William
Bought by
Bennett Amy Kathryn
Current Estimated Value
Purchase Details
Closed on
May 21, 2013
Sold by
Rvz Inc
Bought by
Mccrory Adam
Home Financials for this Owner
Home Financials are based on the most recent Mortgage that was taken out on this home.
Original Mortgage
$88,658
Interest Rate
3.38%
Mortgage Type
New Conventional
Purchase Details
Closed on
Sep 12, 2012
Sold by
Parsons Darrell Perry and Parsons Laurie S
Bought by
Rvz Inc
Purchase Details
Closed on
Mar 21, 2011
Sold by
Ford Kirk A
Bought by
Parsons Darrell Pery and Parsons Laurie S
Purchase Details
Closed on
Apr 30, 2010
Sold by
Parsons Darrell Perry and Parsons Laurie S
Bought by
Ford Kirk A
Create a Home Valuation Report for This Property
The Home Valuation Report is an in-depth analysis detailing your home's value as well as a comparison with similar homes in the area
Home Values in the Area
Average Home Value in this Area
Purchase History
| Date | Buyer | Sale Price | Title Company |
|---|---|---|---|
| Bennett Amy Kathryn | -- | -- | |
| Mccrory Adam | -- | -- | |
| Rvz Inc | $60,341 | None Available | |
| Parsons Darrell Pery | -- | None Available | |
| Ford Kirk A | $132,000 | None Available |
Source: Public Records
Mortgage History
| Date | Status | Borrower | Loan Amount |
|---|---|---|---|
| Previous Owner | Mccrory Adam | $88,658 | |
| Closed | Ford Kirk A | $0 |
Source: Public Records
Tax History Compared to Growth
Tax History
| Year | Tax Paid | Tax Assessment Tax Assessment Total Assessment is a certain percentage of the fair market value that is determined by local assessors to be the total taxable value of land and additions on the property. | Land | Improvement |
|---|---|---|---|---|
| 2024 | $3,872 | $210,600 | $42,100 | $168,500 |
| 2023 | $3,642 | $195,300 | $42,100 | $153,200 |
| 2022 | $1,740 | $188,200 | $42,100 | $146,100 |
| 2021 | $1,864 | $184,100 | $47,500 | $136,600 |
| 2020 | $1,525 | $154,300 | $39,600 | $114,700 |
| 2019 | $1,496 | $158,700 | $41,600 | $117,100 |
| 2018 | $1,429 | $158,700 | $41,600 | $117,100 |
| 2017 | $1,264 | $145,600 | $40,400 | $105,200 |
| 2016 | $1,178 | $147,200 | $31,100 | $116,100 |
| 2014 | $962 | $137,500 | $29,400 | $108,100 |
| 2013 | -- | $135,000 | $28,200 | $106,800 |
Source: Public Records
Map
Nearby Homes
- 7408 N Janna Dr
- 8207 N Myers Rd
- 1910 E Delta Dr
- 1904 W Sun Valley Pkwy
- 2100 W Royerton Rd
- 2104 E Delta Dr
- 2117 W Sacramento Dr
- TBD E State Road 28
- 8204 N Tahoe Dr
- 3001 E Oaklawn Dr
- 2804 W Palisades Pkwy
- 7100 N Wheeling Ave
- 2805 W Preserve Ln
- 3004 Claybridge Ln
- 73 Emerald Pointe Way
- 72 Emerald Pointe Way
- 0 Emerald Pointe Way Unit 202508714
- 69 Falcon Point Ct
- 67 Falcon Point Ct
- 66 Falcon Point Ct
- 7704 N Walnut St
- 7601 N Walnut St
- 200 W Lynnwood Ln
- 7817 N Walnut St
- 1599 N Walnut St
- 206 W Lynnwood Ln
- 205 W Lynnwood Ln
- 7501 N Walnut St
- 7504 N Perry Ct
- 7600 N Hamilton Dr
- 7500 N Perry Ct
- 8009 N Walnut St
- 7508 N Hamilton Dr
- 7408 N Perry Ct
- 7409 N Walnut St
- 7501 N Perry Ct
- 7506 N Hamilton Dr
- 400 W Darrell Dr
- 7404 N Perry Ct
- 7504 N Hamilton Dr