Estimated Value: $538,323 - $604,000
3
Beds
3
Baths
1,909
Sq Ft
$298/Sq Ft
Est. Value
About This Home
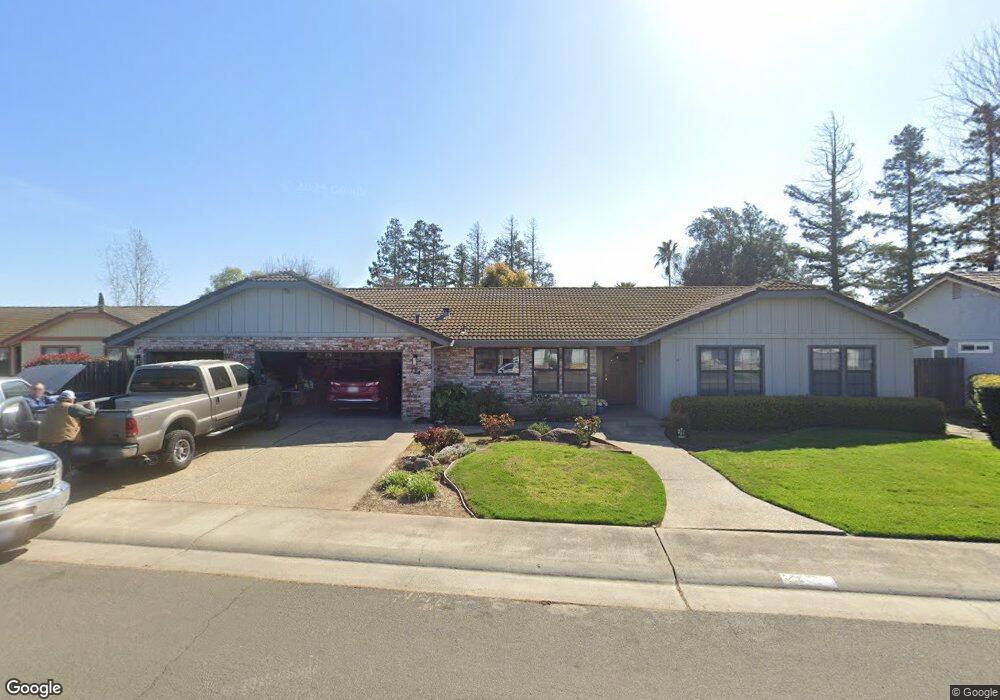
This home is located at 774 Alta Vista Ct, Galt, CA 95632 and is currently estimated at $569,581, approximately $298 per square foot. 774 Alta Vista Ct is a home located in Sacramento County with nearby schools including River Oaks Elementary School, Robert L. McCaffrey Middle School, and Liberty Ranch High School.
Ownership History
Date
Name
Owned For
Owner Type
Purchase Details
Closed on
Feb 10, 2000
Sold by
Casjens Allen and Casjens Laverne
Bought by
Casjens Allen G and Casjens Laverne M
Current Estimated Value
Purchase Details
Closed on
Jun 18, 1997
Sold by
Karthauser Dennis P and Karthauser Geneva M
Bought by
Casjens Allen and Casjens Laverne
Home Financials for this Owner
Home Financials are based on the most recent Mortgage that was taken out on this home.
Original Mortgage
$60,000
Outstanding Balance
$8,534
Interest Rate
7.91%
Estimated Equity
$561,047
Purchase Details
Closed on
Apr 4, 1994
Sold by
Lamb Bobbie J
Bought by
Karthauser Dennis P and Karthauser Geneva M
Home Financials for this Owner
Home Financials are based on the most recent Mortgage that was taken out on this home.
Original Mortgage
$166,500
Interest Rate
7.38%
Create a Home Valuation Report for This Property
The Home Valuation Report is an in-depth analysis detailing your home's value as well as a comparison with similar homes in the area
Home Values in the Area
Average Home Value in this Area
Purchase History
| Date | Buyer | Sale Price | Title Company |
|---|---|---|---|
| Casjens Allen G | -- | -- | |
| Casjens Allen | $170,000 | Commonwealth Land Title Co | |
| Karthauser Dennis P | $185,000 | North American Title Co Inc |
Source: Public Records
Mortgage History
| Date | Status | Borrower | Loan Amount |
|---|---|---|---|
| Open | Casjens Allen | $60,000 | |
| Previous Owner | Karthauser Dennis P | $166,500 |
Source: Public Records
Tax History Compared to Growth
Tax History
| Year | Tax Paid | Tax Assessment Tax Assessment Total Assessment is a certain percentage of the fair market value that is determined by local assessors to be the total taxable value of land and additions on the property. | Land | Improvement |
|---|---|---|---|---|
| 2025 | $2,968 | $276,851 | $40,702 | $236,149 |
| 2024 | $2,968 | $271,423 | $39,904 | $231,519 |
| 2023 | $2,917 | $266,102 | $39,122 | $226,980 |
| 2022 | $2,798 | $260,885 | $38,355 | $222,530 |
| 2021 | $2,799 | $255,770 | $37,603 | $218,167 |
| 2020 | $2,775 | $253,148 | $37,218 | $215,930 |
| 2019 | $2,705 | $248,186 | $36,489 | $211,697 |
| 2018 | $2,699 | $243,321 | $35,774 | $207,547 |
| 2017 | $2,592 | $238,551 | $35,073 | $203,478 |
| 2016 | $2,489 | $233,875 | $34,386 | $199,489 |
| 2015 | $2,402 | $230,363 | $33,870 | $196,493 |
| 2014 | $2,394 | $225,851 | $33,207 | $192,644 |
Source: Public Records
Map
Nearby Homes
- 749 Alta Vista Ct
- 733 Prairie Ct
- 832 Lupine Ct
- 726 Willowgreen Cir
- 859 Pecan Tree Ln
- 860 Pecan Tree Ln
- 872 Pecan Tree Ln
- 809 Ashboro Ln
- 692 Arlene Ct
- Creekside Plan 1 at Parlin Oaks
- Creekside Plan 2 at Parlin Oaks
- 713 Cedar Flat Way
- 663 Canyon Creek Way
- 924 Cobden Ct
- 933 Colson Ct
- 820 N Lincoln Way Unit 73
- 820 N Lincoln Way Unit 42
- 980 Hansard Ct
- 968 Posey St
- 953 Posey St
- 766 Alta Vista Ct
- 782 Alta Vista Ct
- 773 Alta Vista Ct
- 765 Alta Vista Ct
- 781 Alta Vista Ct
- 825 Emerald Vista Dr
- 833 Emerald Vista Dr
- 790 Alta Vista Ct
- 757 Alta Vista Ct
- 789 Alta Vista Ct
- 791 Los Flores Ct
- 783 Los Flores Ct
- 782 Avondale Ct
- 774 Avondale Ct
- 817 Emerald Vista Dr
- 766 Avondale Ct
- 758 Avondale Ct
- 816 Poppy Ct
- 790 Avondale Ct
- 809 Emerald Vista Dr