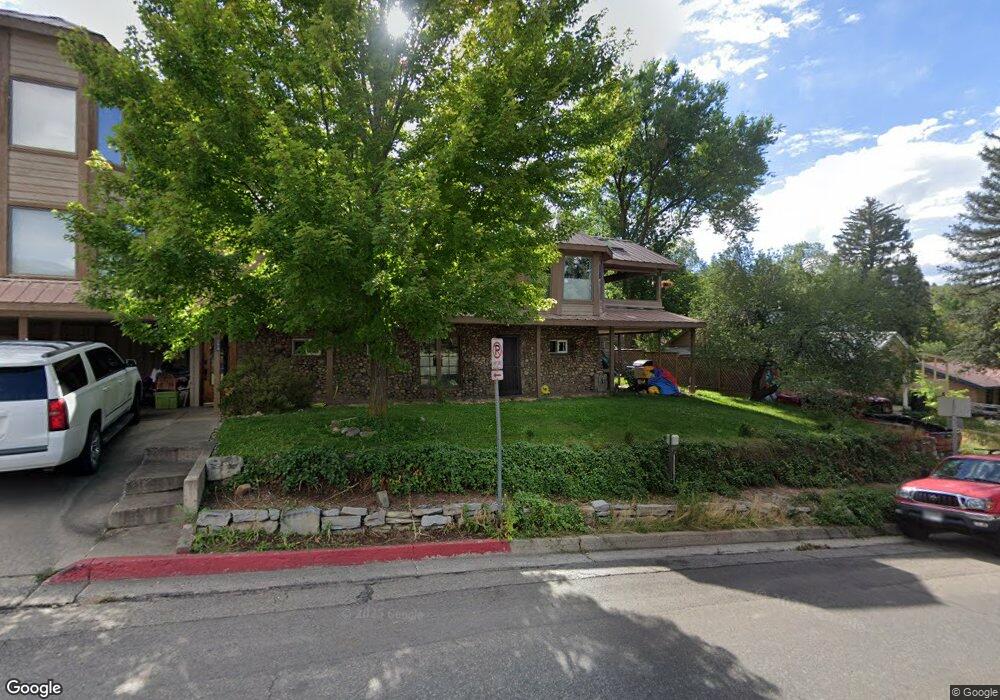
774 E 8th Ave Durango, CO 81301
The Grid NeighborhoodEstimated Value: $1,140,000 - $1,586,000
5
Beds
3
Baths
3,240
Sq Ft
$447/Sq Ft
Est. Value
About This Home
This home is located at 774 E 8th Ave, Durango, CO 81301 and is currently estimated at $1,448,839, approximately $447 per square foot. 774 E 8th Ave is a home located in La Plata County with nearby schools including Park Elementary School, Escalante Middle School, and Durango High School.
Ownership History
Date
Name
Owned For
Owner Type
Purchase Details
Closed on
Dec 15, 2017
Sold by
Kostainsek Victor and Gillaspy Patricia
Bought by
Ashby Jordan Anthony and Ashby Margaret Rosemary
Current Estimated Value
Home Financials for this Owner
Home Financials are based on the most recent Mortgage that was taken out on this home.
Original Mortgage
$424,000
Outstanding Balance
$356,971
Interest Rate
3.94%
Mortgage Type
New Conventional
Estimated Equity
$1,091,868
Purchase Details
Closed on
Sep 15, 2010
Sold by
Kostainsek Victor and Gillaspy Patricia
Bought by
Kostainsek Victor and Gillaspy Patricia
Home Financials for this Owner
Home Financials are based on the most recent Mortgage that was taken out on this home.
Original Mortgage
$260,000
Interest Rate
4.51%
Mortgage Type
New Conventional
Purchase Details
Closed on
Nov 22, 2004
Bought by
Ashby Jordan Anthony and Ashby Margaret Rosemari
Create a Home Valuation Report for This Property
The Home Valuation Report is an in-depth analysis detailing your home's value as well as a comparison with similar homes in the area
Home Values in the Area
Average Home Value in this Area
Purchase History
| Date | Buyer | Sale Price | Title Company |
|---|---|---|---|
| Ashby Jordan Anthony | $666,000 | Land Title Guarantee Co | |
| Kostainsek Victor | -- | Service Link | |
| Ashby Jordan Anthony | $469,900 | -- |
Source: Public Records
Mortgage History
| Date | Status | Borrower | Loan Amount |
|---|---|---|---|
| Open | Ashby Jordan Anthony | $424,000 | |
| Previous Owner | Kostainsek Victor | $260,000 |
Source: Public Records
Tax History
| Year | Tax Paid | Tax Assessment Tax Assessment Total Assessment is a certain percentage of the fair market value that is determined by local assessors to be the total taxable value of land and additions on the property. | Land | Improvement |
|---|---|---|---|---|
| 2025 | $3,062 | $75,890 | $23,540 | $52,350 |
| 2024 | $2,605 | $64,810 | $17,980 | $46,830 |
| 2023 | $2,605 | $68,150 | $18,910 | $49,240 |
| 2022 | $2,199 | $71,050 | $19,710 | $51,340 |
| 2021 | $2,208 | $55,640 | $16,960 | $38,680 |
| 2020 | $2,042 | $53,120 | $16,730 | $36,390 |
| 2019 | $1,953 | $53,120 | $16,730 | $36,390 |
| 2018 | $1,815 | $49,960 | $15,850 | $34,110 |
| 2017 | $1,774 | $49,960 | $15,850 | $34,110 |
| 2016 | $1,623 | $49,790 | $15,150 | $34,640 |
| 2015 | $1,520 | $49,790 | $15,150 | $34,640 |
| 2014 | -- | $44,070 | $14,560 | $29,510 |
| 2013 | -- | $44,070 | $14,560 | $29,510 |
Source: Public Records
Map
Nearby Homes
- 555 E 7th Ave
- 561 E 6th Ave
- 703 E 4th St
- 834 E 4th Ave
- 549 E 5th Ave
- 315 E 8th Ave Unit 203
- 960 E 4th Ave
- 378 E 6th Ave
- 558 E 4th Ave
- 732 E 4th St
- 458 E 4th Ave
- 522 E 3rd Ave
- 0 Tbd Unit 11662135
- 0 Tbd Unit 26426680
- Lot 15 Taylor Ranch Rd
- 270 E College Dr Unit 202
- 190 E 7th Ave Unit A-2
- TBD Wilson Gulch Rd
- 355 E 3rd Ave Unit 112
- 543 E 2nd Ave Unit 1D
- 772 E 8th Ave
- 740 E 8th Ave
- 777 E 8th Ave
- 736 E 8th Ave
- 769 E 8th St
- 734 E 8th Ave
- 755 E 8th Ave
- 757 E 8th St
- 743 E 8th Ave
- E E 8th Ave Unit 10
- E E 8th Ave Unit 15
- E E 8th Ave Unit 2 Avenue
- E E 8th Ave Unit 3
- E E 8th Ave Unit 18
- E E 8th Ave Unit 8
- E E 8th Ave Unit 206
- E E 8th Ave Unit End O Day Motel
- E E 8th Ave Unit 736 E. 5th St.
- E E 8th Ave Unit commercial and multi
- E E 8th Ave Unit 12
Your Personal Tour Guide
Ask me questions while you tour the home.