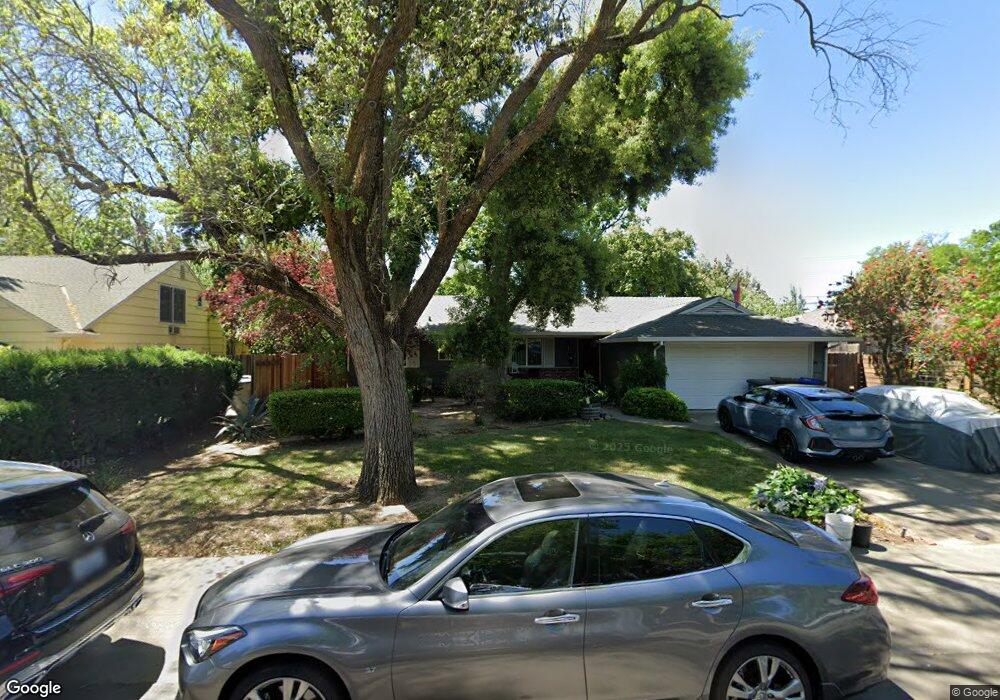
776 Mulberry Ln Davis, CA 95616
Central Davis NeighborhoodEstimated Value: $795,000 - $886,000
4
Beds
3
Baths
1,641
Sq Ft
$500/Sq Ft
Est. Value
About This Home
This home is located at 776 Mulberry Ln, Davis, CA 95616 and is currently estimated at $820,177, approximately $499 per square foot. 776 Mulberry Ln is a home located in Yolo County with nearby schools including Robert E. Willett Elementary School, Ralph Waldo Emerson Junior High School, and Davis Senior High School.
Ownership History
Date
Name
Owned For
Owner Type
Purchase Details
Closed on
Oct 10, 2001
Sold by
King Judith A
Bought by
King Judith A and Judith A King Family Trust
Current Estimated Value
Purchase Details
Closed on
Jul 23, 2001
Sold by
Kennedy Robert L
Bought by
King Judith A
Purchase Details
Closed on
Jun 19, 2001
Sold by
King Stephen L
Bought by
King Judith A
Purchase Details
Closed on
Jul 1, 1996
Sold by
Tracy Craig A
Bought by
Kennedy Robert L
Home Financials for this Owner
Home Financials are based on the most recent Mortgage that was taken out on this home.
Original Mortgage
$184,800
Interest Rate
8.01%
Mortgage Type
Balloon
Purchase Details
Closed on
Jul 8, 1993
Sold by
Tracy Maureen E
Bought by
Tracy Craig A
Home Financials for this Owner
Home Financials are based on the most recent Mortgage that was taken out on this home.
Original Mortgage
$151,500
Interest Rate
7.48%
Create a Home Valuation Report for This Property
The Home Valuation Report is an in-depth analysis detailing your home's value as well as a comparison with similar homes in the area
Home Values in the Area
Average Home Value in this Area
Purchase History
| Date | Buyer | Sale Price | Title Company |
|---|---|---|---|
| King Judith A | -- | -- | |
| King Judith A | $362,000 | Fidelity National Title Co | |
| King Judith A | -- | Fidelity National Title Co | |
| Kennedy Robert L | $231,000 | Fidelity National Title Co | |
| Tracy Craig A | -- | North American Title Company |
Source: Public Records
Mortgage History
| Date | Status | Borrower | Loan Amount |
|---|---|---|---|
| Previous Owner | Kennedy Robert L | $184,800 | |
| Previous Owner | Tracy Craig A | $151,500 |
Source: Public Records
Tax History
| Year | Tax Paid | Tax Assessment Tax Assessment Total Assessment is a certain percentage of the fair market value that is determined by local assessors to be the total taxable value of land and additions on the property. | Land | Improvement |
|---|---|---|---|---|
| 2025 | $7,211 | $534,759 | $132,943 | $401,816 |
| 2023 | $7,211 | $513,996 | $127,782 | $386,214 |
| 2022 | $6,909 | $503,919 | $125,277 | $378,642 |
| 2021 | $6,745 | $494,039 | $122,821 | $371,218 |
| 2020 | $6,637 | $488,974 | $121,562 | $367,412 |
| 2019 | $6,327 | $479,387 | $119,179 | $360,208 |
| 2018 | $5,895 | $469,989 | $116,843 | $353,146 |
| 2017 | $5,772 | $460,774 | $114,552 | $346,222 |
| 2016 | $5,592 | $451,740 | $112,306 | $339,434 |
| 2015 | $5,401 | $444,956 | $110,620 | $334,336 |
| 2014 | $5,401 | $436,241 | $108,454 | $327,787 |
Source: Public Records
Map
Nearby Homes
- 770 Mulberry Ln
- 780 Mulberry Ln
- 740 Hawthorne Ln
- 746 Hawthorne Ln
- 746 Hawthorn Ln
- 784 Mulberry Ln
- 754 Hawthorne Ln
- 734 Hawthorn Ln
- 734 Hawthorn Ln
- 777 Mulberry Ln
- 771 Mulberry Ln
- 781 Mulberry Ln
- 762 Hawthorne Ln
- 722 Hawthorne Ln
- 788 Mulberry Ln
- 764 Mulberry Ln
- 728 Hawthorn Ln
- 787 Mulberry Ln
- 768 Hawthorne Ln
- 1002 Vassar Dr
Your Personal Tour Guide
Ask me questions while you tour the home.