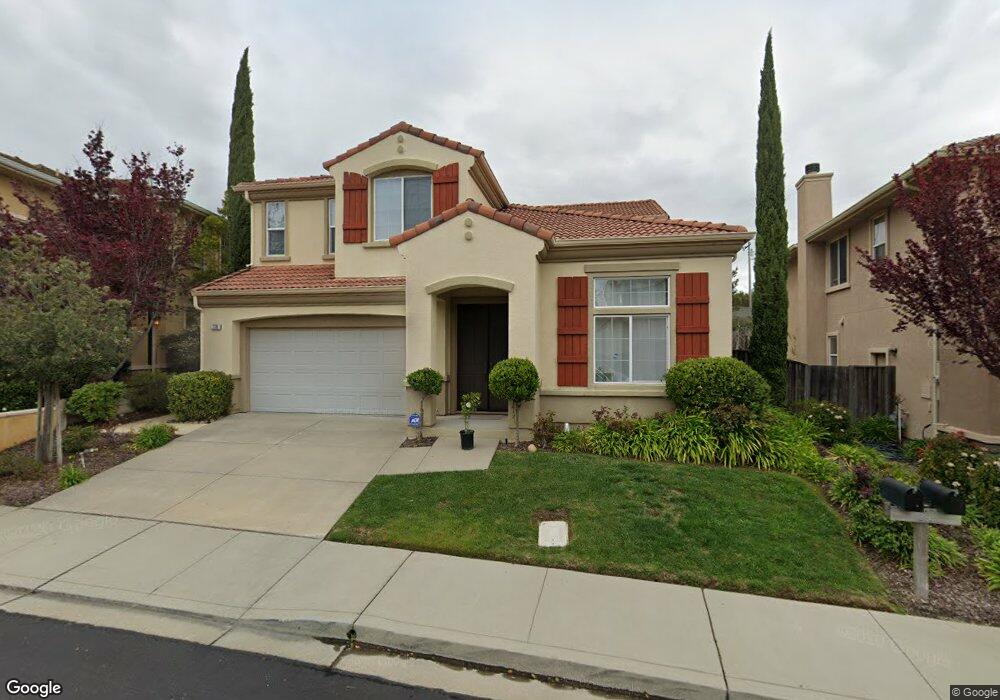
776 Pradera Way San Ramon, CA 94583
Twin Creeks NeighborhoodEstimated Value: $1,816,821 - $1,921,000
4
Beds
3
Baths
2,535
Sq Ft
$734/Sq Ft
Est. Value
About This Home
This home is located at 776 Pradera Way, San Ramon, CA 94583 and is currently estimated at $1,859,955, approximately $733 per square foot. 776 Pradera Way is a home located in Contra Costa County with nearby schools including Twin Creeks Elementary School, Iron Horse Middle School, and California High School.
Ownership History
Date
Name
Owned For
Owner Type
Purchase Details
Closed on
Jun 26, 2019
Sold by
Ganti Akhila S
Bought by
Patil Reena T and Gangla Bhupen U
Current Estimated Value
Home Financials for this Owner
Home Financials are based on the most recent Mortgage that was taken out on this home.
Original Mortgage
$1,095,000
Outstanding Balance
$950,234
Interest Rate
3.37%
Mortgage Type
Adjustable Rate Mortgage/ARM
Estimated Equity
$909,721
Purchase Details
Closed on
Apr 28, 2000
Sold by
Lyon Manor At Thomas Ranch Llc
Bought by
Ganti Akhila S
Home Financials for this Owner
Home Financials are based on the most recent Mortgage that was taken out on this home.
Original Mortgage
$417,150
Interest Rate
7.62%
Mortgage Type
Purchase Money Mortgage
Create a Home Valuation Report for This Property
The Home Valuation Report is an in-depth analysis detailing your home's value as well as a comparison with similar homes in the area
Home Values in the Area
Average Home Value in this Area
Purchase History
| Date | Buyer | Sale Price | Title Company |
|---|---|---|---|
| Patil Reena T | $1,220,000 | Chicago Title Company | |
| Ganti Akhila S | $521,500 | First American Title Guarant | |
| Ganti Akhila S | -- | First American Title Guarant |
Source: Public Records
Mortgage History
| Date | Status | Borrower | Loan Amount |
|---|---|---|---|
| Open | Patil Reena T | $1,095,000 | |
| Previous Owner | Ganti Akhila S | $417,150 | |
| Closed | Ganti Akhila S | $52,143 |
Source: Public Records
Tax History Compared to Growth
Tax History
| Year | Tax Paid | Tax Assessment Tax Assessment Total Assessment is a certain percentage of the fair market value that is determined by local assessors to be the total taxable value of land and additions on the property. | Land | Improvement |
|---|---|---|---|---|
| 2025 | $15,524 | $1,360,927 | $780,861 | $580,066 |
| 2024 | $15,270 | $1,334,243 | $765,550 | $568,693 |
| 2023 | $15,270 | $1,308,083 | $750,540 | $557,543 |
| 2022 | $15,143 | $1,282,435 | $735,824 | $546,611 |
| 2021 | $14,813 | $1,257,291 | $721,397 | $535,894 |
| 2019 | $9,009 | $719,395 | $314,136 | $405,259 |
| 2018 | $8,676 | $705,290 | $307,977 | $397,313 |
| 2017 | $8,361 | $691,462 | $301,939 | $389,523 |
| 2016 | $8,249 | $677,905 | $296,019 | $381,886 |
| 2015 | $8,062 | $667,723 | $291,573 | $376,150 |
| 2014 | $7,947 | $654,644 | $285,862 | $368,782 |
Source: Public Records
Map
Nearby Homes
- 22 Cobblestone Ct
- 15 Creekside Dr
- 18895 Bollinger Canyon Rd
- 168 Shadowhill Cir
- 219 Forest Creek Ln
- 2749 Fountainhead Dr
- 2809 Fountainhead Dr
- 22208 Argento Loop
- 20202 Argento Loop
- 2857 Fountainhead Dr
- 663 Abrigo Ct
- 61109 Via Vicenza
- 732 Fountainhead Ct
- 334 La Paz Ct
- 2552 Veneto Ct
- 1721 Tierra Ct
- 121 Skyline Dr Unit 5
- 305 Daybreak Ct
- 407 Daybreak Ct Unit 28
- 1204 Destiny Ln
- 772 Pradera Way
- 778 Pradera Way
- 770 Pradera Way
- 780 Pradera Way
- 775 Pradera Way
- 791 Pradera Way
- 768 Pradera Way
- 771 Pradera Way
- 782 Pradera Way
- 795 Pradera Way
- 766 Pradera Way
- 769 Pradera Way
- 786 Pradera Way
- 797 Pradera Way
- 932 Regalo Way
- 767 Pradera Way
- 788 Pradera Way
- 762 Pradera Way
- 790 Pradera Way
- 792 Pradera Way