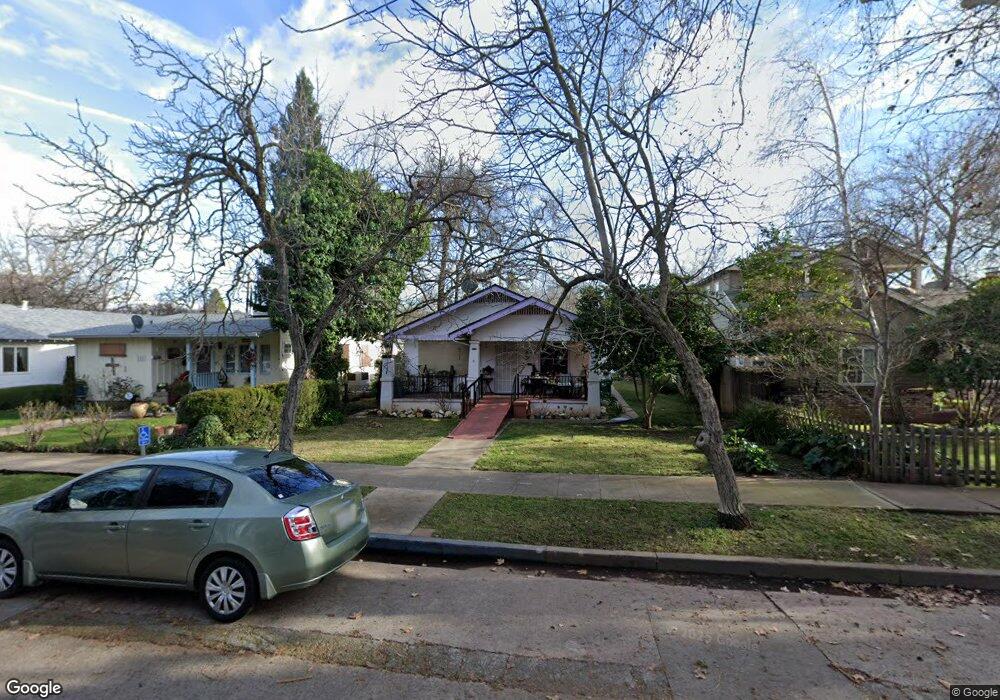
779 E 7th St Chico, CA 95928
East Streets NeighborhoodEstimated Value: $281,000 - $419,000
3
Beds
1
Bath
1,274
Sq Ft
$289/Sq Ft
Est. Value
About This Home
This home is located at 779 E 7th St, Chico, CA 95928 and is currently estimated at $367,637, approximately $288 per square foot. 779 E 7th St is a home located in Butte County with nearby schools including Parkview Elementary School, Chico Junior High School, and Chico High School.
Ownership History
Date
Name
Owned For
Owner Type
Purchase Details
Closed on
May 11, 2004
Sold by
Tolen Norma E
Bought by
Tolen Narsease A
Current Estimated Value
Home Financials for this Owner
Home Financials are based on the most recent Mortgage that was taken out on this home.
Original Mortgage
$299,250
Outstanding Balance
$116,708
Interest Rate
3.13%
Mortgage Type
FHA
Estimated Equity
$250,929
Purchase Details
Closed on
Dec 28, 2001
Sold by
Hutt Dorothy M
Bought by
Tolen Norma E
Purchase Details
Closed on
Dec 20, 2001
Sold by
Smith Evelyn L
Bought by
Tolen Norma E
Purchase Details
Closed on
Jul 3, 2000
Sold by
Dixon Sadie J
Bought by
Smith Evelyn L and Hutt Dorothy M
Create a Home Valuation Report for This Property
The Home Valuation Report is an in-depth analysis detailing your home's value as well as a comparison with similar homes in the area
Home Values in the Area
Average Home Value in this Area
Purchase History
| Date | Buyer | Sale Price | Title Company |
|---|---|---|---|
| Tolen Narsease A | -- | Multiple | |
| Tolen Norma E | -- | -- | |
| Tolen Norma E | -- | -- | |
| Smith Evelyn L | -- | -- |
Source: Public Records
Mortgage History
| Date | Status | Borrower | Loan Amount |
|---|---|---|---|
| Open | Tolen Narsease A | $299,250 | |
| Closed | Tolen Narsease A | $299,250 |
Source: Public Records
Tax History
| Year | Tax Paid | Tax Assessment Tax Assessment Total Assessment is a certain percentage of the fair market value that is determined by local assessors to be the total taxable value of land and additions on the property. | Land | Improvement |
|---|---|---|---|---|
| 2025 | $1,945 | $185,800 | $88,895 | $96,905 |
| 2024 | $1,945 | $182,157 | $87,152 | $95,005 |
| 2023 | $1,920 | $178,587 | $85,444 | $93,143 |
| 2022 | $1,887 | $175,086 | $83,769 | $91,317 |
| 2021 | $1,850 | $171,654 | $82,127 | $89,527 |
| 2020 | $1,844 | $169,895 | $81,285 | $88,610 |
| 2019 | $1,810 | $166,565 | $79,692 | $86,873 |
| 2018 | $1,775 | $163,300 | $78,130 | $85,170 |
| 2017 | $1,737 | $160,099 | $76,599 | $83,500 |
| 2016 | $1,584 | $156,961 | $75,098 | $81,863 |
| 2015 | $1,583 | $154,604 | $73,970 | $80,634 |
| 2014 | $1,544 | $151,577 | $72,522 | $79,055 |
Source: Public Records
Map
Nearby Homes
- 686 E 7th St
- 667 E 8th St
- 0 California 32
- 1022 Linden St
- 555 Vallombrosa Ave Unit 14
- 555 Vallombrosa Ave Unit 25
- 1169 E 9th St
- 271 E 8th St
- 1224 Locust St
- 1368 E 9th St
- 827 Arbutus Ave
- 1385 E 10th St
- 1001 Salem St
- 1157 Broadway St
- 1029 Salem St
- 1764 Elm St
- 1640 Hemlock St
- 951 Cleveland Ave
- 1322 Guill St
- 225 W 12th St
Your Personal Tour Guide
Ask me questions while you tour the home.