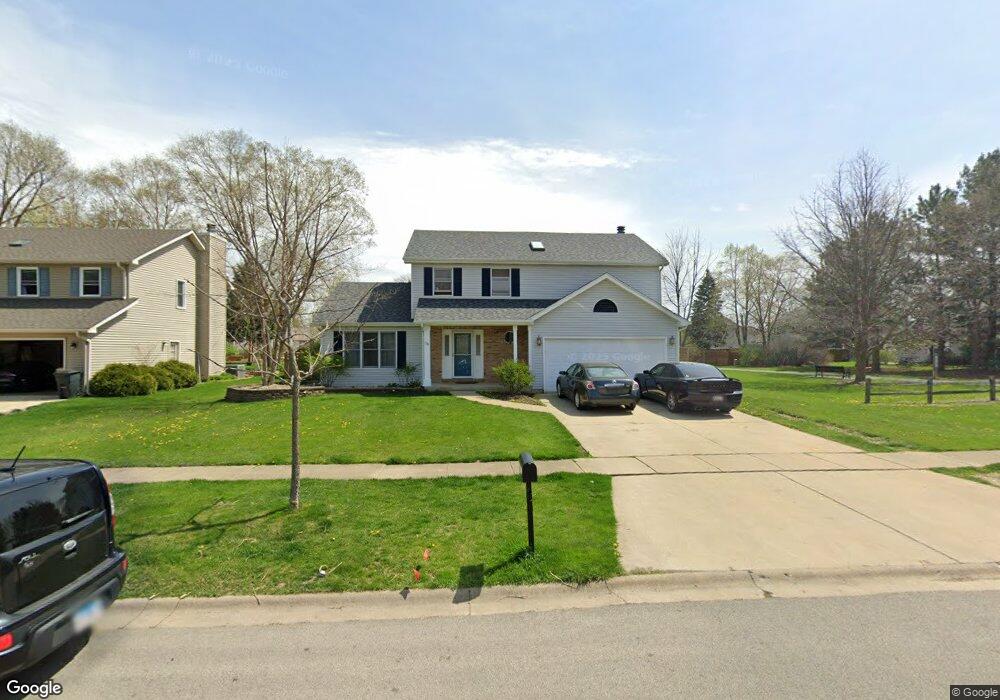
78 Brock Way Oswego, IL 60543
Boulder Hill NeighborhoodEstimated Value: $382,000 - $410,000
4
Beds
3
Baths
1,904
Sq Ft
$210/Sq Ft
Est. Value
About This Home
This home is located at 78 Brock Way, Oswego, IL 60543 and is currently estimated at $400,297, approximately $210 per square foot. 78 Brock Way is a home located in Kendall County with nearby schools including Old Post Elementary School, Thompson Jr. High School, and Oswego High School.
Ownership History
Date
Name
Owned For
Owner Type
Purchase Details
Closed on
Aug 24, 2023
Sold by
Zanoni Shawn
Bought by
Salazar Mary Stephanie and Quezada Gerardo Salazar
Current Estimated Value
Home Financials for this Owner
Home Financials are based on the most recent Mortgage that was taken out on this home.
Original Mortgage
$333,841
Outstanding Balance
$326,234
Interest Rate
6.81%
Mortgage Type
FHA
Estimated Equity
$74,063
Purchase Details
Closed on
Jul 20, 2023
Sold by
Zanoni Shawn D and Hillebold Lisa M
Bought by
Zanoni Shawn D
Home Financials for this Owner
Home Financials are based on the most recent Mortgage that was taken out on this home.
Original Mortgage
$333,841
Outstanding Balance
$326,234
Interest Rate
6.81%
Mortgage Type
FHA
Estimated Equity
$74,063
Purchase Details
Closed on
Jun 19, 2014
Sold by
Pnc Bank National Association
Bought by
Zanoni Shawn D and Hillebold Lisa M
Home Financials for this Owner
Home Financials are based on the most recent Mortgage that was taken out on this home.
Original Mortgage
$152,000
Interest Rate
5.25%
Mortgage Type
Unknown
Purchase Details
Closed on
Dec 2, 2013
Sold by
James Mark S
Bought by
Pnc Bank National Association
Purchase Details
Closed on
Feb 6, 2004
Sold by
Probst Thomas W and Probst Joni L
Bought by
James Mark S
Home Financials for this Owner
Home Financials are based on the most recent Mortgage that was taken out on this home.
Original Mortgage
$223,200
Interest Rate
5.5%
Mortgage Type
Purchase Money Mortgage
Purchase Details
Closed on
May 1, 1987
Purchase Details
Closed on
Nov 1, 1985
Create a Home Valuation Report for This Property
The Home Valuation Report is an in-depth analysis detailing your home's value as well as a comparison with similar homes in the area
Home Values in the Area
Average Home Value in this Area
Purchase History
| Date | Buyer | Sale Price | Title Company |
|---|---|---|---|
| Salazar Mary Stephanie | $340,000 | Fidelity National Title | |
| Zanoni Shawn D | -- | None Listed On Document | |
| Zanoni Shawn D | $190,000 | Premier Title | |
| Pnc Bank National Association | $188,100 | None Available | |
| James Mark S | $248,000 | First American Title Ins Co | |
| -- | $14,000 | -- | |
| -- | $35,000 | -- |
Source: Public Records
Mortgage History
| Date | Status | Borrower | Loan Amount |
|---|---|---|---|
| Open | Salazar Mary Stephanie | $333,841 | |
| Previous Owner | Zanoni Shawn D | $152,000 | |
| Previous Owner | James Mark S | $223,200 |
Source: Public Records
Tax History Compared to Growth
Tax History
| Year | Tax Paid | Tax Assessment Tax Assessment Total Assessment is a certain percentage of the fair market value that is determined by local assessors to be the total taxable value of land and additions on the property. | Land | Improvement |
|---|---|---|---|---|
| 2024 | $9,422 | $117,080 | $21,511 | $95,569 |
| 2023 | $0 | $113,669 | $20,884 | $92,785 |
| 2022 | $9,051 | $106,233 | $19,518 | $86,715 |
| 2021 | $8,728 | $99,283 | $18,241 | $81,042 |
| 2020 | $8,453 | $95,464 | $17,539 | $77,925 |
| 2019 | $9,065 | $100,438 | $17,539 | $82,899 |
| 2018 | $8,303 | $91,649 | $16,004 | $75,645 |
| 2017 | $8,044 | $84,469 | $14,750 | $69,719 |
| 2016 | $7,436 | $77,494 | $13,532 | $63,962 |
| 2015 | $7,173 | $71,754 | $12,530 | $59,224 |
| 2014 | -- | $68,994 | $12,048 | $56,946 |
| 2013 | -- | $72,625 | $12,682 | $59,943 |
Source: Public Records
Map
Nearby Homes
- 22 Sherwick Rd
- 38 Ashlawn Ave
- 9 Cebold Dr
- 3 Orchard Rd
- 123 Orchard Rd
- 2 Orchard Rd
- 4 Circle Ct
- 10 Crofton Rd
- 40 Codorus Rd
- 47 Old Post Rd
- 156 River Mist Dr
- 141 River Mist Dr
- 2110 State Route 31
- 1415 State Route 31
- 420 Chesterfield Ct Unit 420
- 39 Cayman Dr
- 2300 Light Rd Unit 209
- 2600 Light Rd Unit 210
- 2100 Light Rd Unit 109
- 7.43 Acres Vacant La State Route 31
- 78 Brockway Dr
- 76 Brockway Dr
- 76 Brock Way
- 74 Brock Way Unit 30
- 77 Brockway Dr
- 77 Brock Way
- 81 Brockway Dr
- 32 Sherwick Rd
- 79 Brock Way
- 203 Northampton Dr
- 83 Brockway Dr
- 72 Brock Way Unit 30
- 72 Brockway Dr
- 83 Brockway Dr
- 28 Eastway Dr
- 81 Brock Way
- 30 Sherwick Rd
- 121 Northampton Dr
- 70 Brock Way
- 70 Brockway Dr