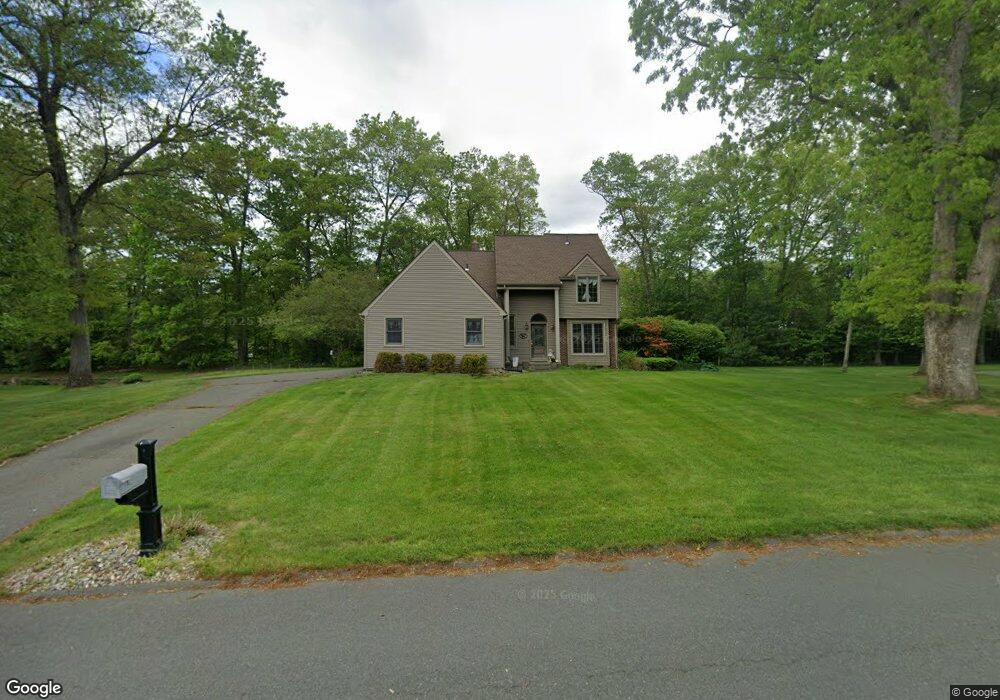
78 Christopher Dr Westfield, MA 01085
Estimated Value: $468,236 - $576,000
3
Beds
3
Baths
1,799
Sq Ft
$286/Sq Ft
Est. Value
About This Home
This home is located at 78 Christopher Dr, Westfield, MA 01085 and is currently estimated at $515,059, approximately $286 per square foot. 78 Christopher Dr is a home located in Hampden County with nearby schools including Westfield High School and Saint Mary High School.
Ownership History
Date
Name
Owned For
Owner Type
Purchase Details
Closed on
Sep 12, 1996
Sold by
Cunneen John P and Cunneen Judith L
Bought by
Groom Carol M and Groom William J
Current Estimated Value
Home Financials for this Owner
Home Financials are based on the most recent Mortgage that was taken out on this home.
Original Mortgage
$132,000
Interest Rate
8.18%
Mortgage Type
Purchase Money Mortgage
Purchase Details
Closed on
Mar 19, 1987
Sold by
Burgoyne William
Bought by
Cunneen John P
Create a Home Valuation Report for This Property
The Home Valuation Report is an in-depth analysis detailing your home's value as well as a comparison with similar homes in the area
Home Values in the Area
Average Home Value in this Area
Purchase History
| Date | Buyer | Sale Price | Title Company |
|---|---|---|---|
| Groom Carol M | $165,000 | -- | |
| Cunneen John P | $185,000 | -- |
Source: Public Records
Mortgage History
| Date | Status | Borrower | Loan Amount |
|---|---|---|---|
| Open | Cunneen John P | $15,000 | |
| Open | Cunneen John P | $133,000 | |
| Closed | Cunneen John P | $132,000 |
Source: Public Records
Tax History
| Year | Tax Paid | Tax Assessment Tax Assessment Total Assessment is a certain percentage of the fair market value that is determined by local assessors to be the total taxable value of land and additions on the property. | Land | Improvement |
|---|---|---|---|---|
| 2025 | $6,171 | $406,500 | $128,800 | $277,700 |
| 2024 | $6,180 | $387,000 | $117,100 | $269,900 |
| 2023 | $6,068 | $370,900 | $111,600 | $259,300 |
| 2022 | $6,068 | $328,200 | $99,600 | $228,600 |
| 2021 | $5,883 | $311,600 | $93,700 | $217,900 |
| 2020 | $5,781 | $300,300 | $93,700 | $206,600 |
| 2019 | $5,653 | $287,400 | $89,200 | $198,200 |
| 2018 | $5,564 | $287,400 | $89,200 | $198,200 |
| 2017 | $5,447 | $280,500 | $90,700 | $189,800 |
| 2016 | $5,453 | $280,500 | $90,700 | $189,800 |
| 2015 | $4,969 | $268,000 | $90,700 | $177,300 |
| 2014 | $3,718 | $268,000 | $90,700 | $177,300 |
Source: Public Records
Map
Nearby Homes
- 242 Eastwood Dr
- 103 Woodcliff Dr
- 120 Woodcliff Dr
- 24 Francis St
- 0 E Mountain Rd
- 189 Springfield Rd Unit 23
- 24 Sunflower Ln Unit B
- 0 Feeding Hills Rd
- 18 Noble St
- 88 Woodmont St
- 63 George St
- 117 Sibley Ave
- 33 George St
- 25 Dubois St
- 19 Arch Rd
- 34 High Meadow Dr
- 0 Lockhouse Rd Unit 73473161
- 2 Cycle St
- 357 Southampton Rd
- Lot 3 Montgomery
- 84 Christopher Dr
- 72 Christopher Dr
- 74 Joseph Ave
- 78 Joseph Ave
- 77 Christopher Dr
- 83 Christopher Dr
- 68 Joseph Ave
- 82 Joseph Ave
- 87 Christopher Dr
- 88 Christopher Dr
- 62 Joseph Ave
- 71 Christopher Dr
- 66 Christopher Dr
- 86 Joseph Ave
- 93 Christopher Dr
- 75 Joseph Ave
- 11 Amy Dr
- 92 Christopher Dr
- 69 Joseph Ave
- 79 Joseph Ave
Your Personal Tour Guide
Ask me questions while you tour the home.