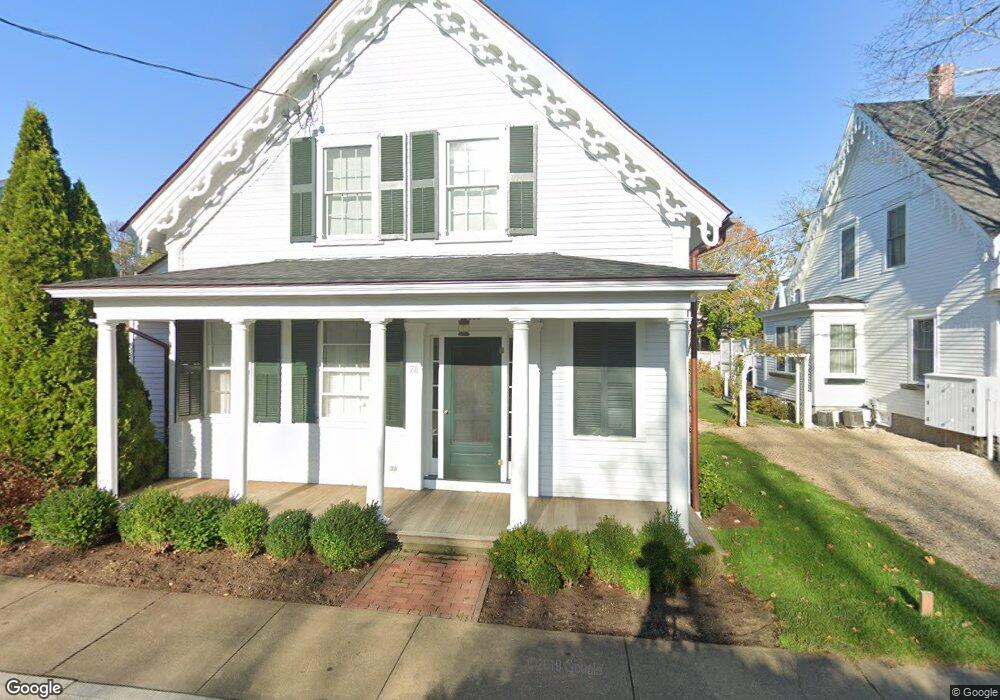
78 S Summer St Edgartown, MA 02539
Edgartown NeighborhoodEstimated Value: $3,929,638 - $4,654,000
5
Beds
5
Baths
3,150
Sq Ft
$1,364/Sq Ft
Est. Value
About This Home
This home is located at 78 S Summer St, Edgartown, MA 02539 and is currently estimated at $4,295,660, approximately $1,363 per square foot. 78 S Summer St is a home located in Dukes County with nearby schools including Edgartown Elementary School and Martha's Vineyard Regional High School.
Ownership History
Date
Name
Owned For
Owner Type
Purchase Details
Closed on
Sep 14, 2007
Sold by
Oconnell John and Oconnell Kelly
Bought by
Schwartz Bart M and Schwartz Cheryl M
Current Estimated Value
Home Financials for this Owner
Home Financials are based on the most recent Mortgage that was taken out on this home.
Original Mortgage
$417,000
Outstanding Balance
$265,770
Interest Rate
6.7%
Mortgage Type
Purchase Money Mortgage
Estimated Equity
$4,029,890
Purchase Details
Closed on
Dec 28, 2005
Sold by
In Frederick R Convery and Lewis Cathy C
Bought by
Oconnell John and Oconnell Kelly
Home Financials for this Owner
Home Financials are based on the most recent Mortgage that was taken out on this home.
Original Mortgage
$1,000,000
Interest Rate
6.39%
Mortgage Type
Purchase Money Mortgage
Create a Home Valuation Report for This Property
The Home Valuation Report is an in-depth analysis detailing your home's value as well as a comparison with similar homes in the area
Home Values in the Area
Average Home Value in this Area
Purchase History
| Date | Buyer | Sale Price | Title Company |
|---|---|---|---|
| Schwartz Bart M | $2,075,000 | -- | |
| Oconnell John | $1,425,000 | -- |
Source: Public Records
Mortgage History
| Date | Status | Borrower | Loan Amount |
|---|---|---|---|
| Open | Schwartz Bart M | $417,000 | |
| Previous Owner | Oconnell John | $1,000,000 |
Source: Public Records
Tax History Compared to Growth
Tax History
| Year | Tax Paid | Tax Assessment Tax Assessment Total Assessment is a certain percentage of the fair market value that is determined by local assessors to be the total taxable value of land and additions on the property. | Land | Improvement |
|---|---|---|---|---|
| 2025 | $8,566 | $3,232,500 | $1,685,900 | $1,546,600 |
| 2024 | $7,657 | $3,002,600 | $1,685,900 | $1,316,700 |
| 2023 | $7,747 | $3,074,200 | $1,712,700 | $1,361,500 |
| 2022 | $9,588 | $3,164,500 | $1,833,100 | $1,331,400 |
| 2021 | $8,709 | $2,655,100 | $1,532,700 | $1,122,400 |
| 2020 | $8,200 | $2,447,700 | $1,459,700 | $988,000 |
| 2019 | $9,762 | $2,522,400 | $1,459,700 | $1,062,700 |
| 2018 | $8,433 | $2,179,000 | $1,306,000 | $873,000 |
| 2017 | $7,653 | $2,155,800 | $1,306,000 | $849,800 |
| 2016 | $8,005 | $2,211,300 | $1,306,000 | $905,300 |
| 2015 | $7,714 | $2,223,000 | $1,262,200 | $960,800 |
Source: Public Records
Map
Nearby Homes
- 8 High St
- 69 School St
- 52 S Summer St
- 11 Norton St
- 43 Peases Point Way S
- 10 Tilton Way
- 25 Dock St
- 10 Peases Point Way N
- 62 N Summer St
- 48 W Tisbury Rd
- 48 Edgartown - West Tisbury Rd
- 68 N Water St
- 23 Pinehurst Rd
- 43 Cottage St
- 26 Curtis Ln
- 117 N Water St
- 19 Kitts Field Cir
- 5 Louis Field Rd
- 5 Louis Field Rd Unit 121.3
- 54 Fuller St