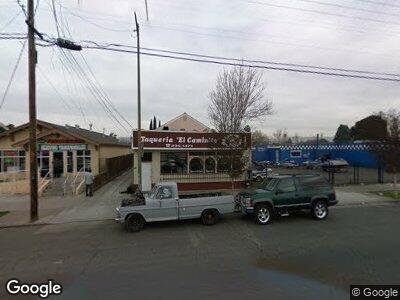
782 N 13th St San Jose, CA 95112
Luna Park NeighborhoodEstimated Value: $1,211,409
--
Bed
--
Bath
540
Sq Ft
$2,243/Sq Ft
Est. Value
About This Home
This home is located at 782 N 13th St, San Jose, CA 95112 and is currently estimated at $1,211,409, approximately $2,243 per square foot. 782 N 13th St is a home located in Santa Clara County with nearby schools including Muwekma Ohlone Middle, San Jose High School, and Ace Inspire Academy.
Ownership History
Date
Name
Owned For
Owner Type
Purchase Details
Closed on
Oct 28, 2023
Sold by
Vanluu Lap and Mai Thanh
Bought by
Luu Revocable Living Trust and Van Luu
Current Estimated Value
Purchase Details
Closed on
May 8, 2000
Sold by
Ng Will P and Yu Wai S
Bought by
Vanluu Lap Van and Luu Mai Thanh
Home Financials for this Owner
Home Financials are based on the most recent Mortgage that was taken out on this home.
Original Mortgage
$174,000
Interest Rate
8.22%
Mortgage Type
Commercial
Purchase Details
Closed on
Jan 20, 1994
Sold by
Ng Will P K and Ng Ornella
Bought by
Suen Ng Will P K and Suen Yu Wai
Create a Home Valuation Report for This Property
The Home Valuation Report is an in-depth analysis detailing your home's value as well as a comparison with similar homes in the area
Home Values in the Area
Average Home Value in this Area
Purchase History
| Date | Buyer | Sale Price | Title Company |
|---|---|---|---|
| Luu Revocable Living Trust | -- | None Listed On Document | |
| Vanluu Lap Van | $340,000 | Fidelity National Title Co | |
| Suen Ng Will P K | -- | -- |
Source: Public Records
Mortgage History
| Date | Status | Borrower | Loan Amount |
|---|---|---|---|
| Previous Owner | Vanluu Lap Van | $174,000 | |
| Closed | Vanluu Lap Van | $60,000 |
Source: Public Records
Tax History Compared to Growth
Tax History
| Year | Tax Paid | Tax Assessment Tax Assessment Total Assessment is a certain percentage of the fair market value that is determined by local assessors to be the total taxable value of land and additions on the property. | Land | Improvement |
|---|---|---|---|---|
| 2024 | $16,022 | $512,304 | $180,809 | $331,495 |
| 2023 | $10,347 | $502,260 | $177,264 | $324,996 |
| 2022 | $9,481 | $492,413 | $173,789 | $318,624 |
| 2021 | $8,471 | $482,759 | $170,382 | $312,377 |
| 2020 | $8,048 | $477,809 | $168,635 | $309,174 |
| 2019 | $8,061 | $468,441 | $165,329 | $303,112 |
| 2018 | $7,992 | $459,257 | $162,088 | $297,169 |
| 2017 | $7,850 | $450,253 | $158,910 | $291,343 |
| 2016 | $7,701 | $441,426 | $155,795 | $285,631 |
| 2015 | $7,546 | $434,796 | $153,455 | $281,341 |
| 2014 | $7,392 | $426,280 | $150,450 | $275,830 |
Source: Public Records
Map
Nearby Homes