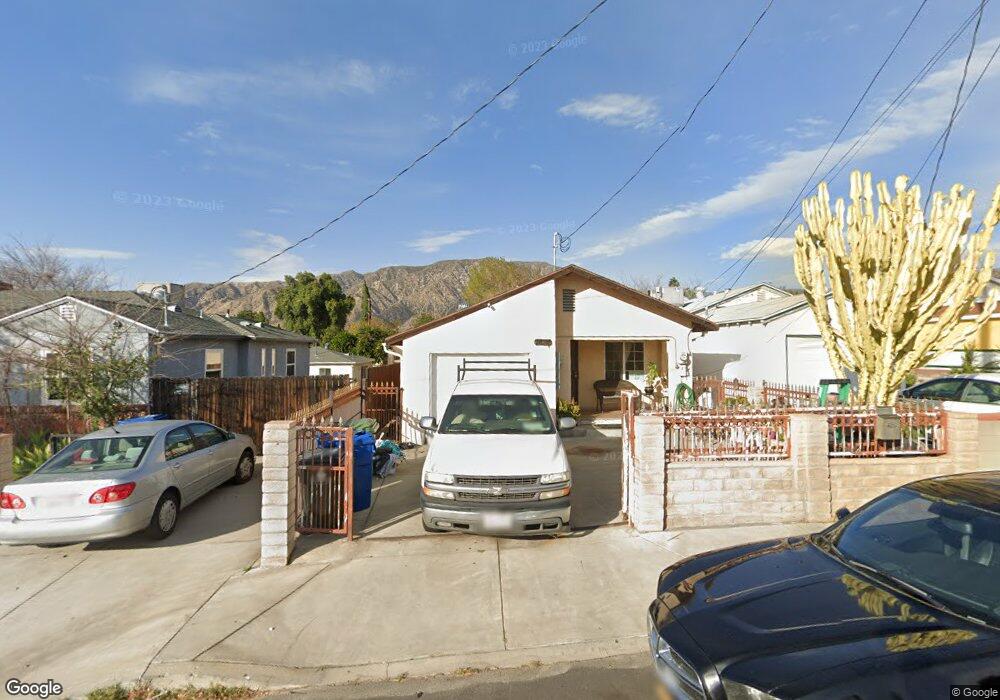
7857 Jayseel St Sunland, CA 91040
Sunland NeighborhoodEstimated Value: $780,193 - $915,000
4
Beds
2
Baths
1,368
Sq Ft
$614/Sq Ft
Est. Value
About This Home
This home is located at 7857 Jayseel St, Sunland, CA 91040 and is currently estimated at $840,548, approximately $614 per square foot. 7857 Jayseel St is a home located in Los Angeles County with nearby schools including Mt. Gleason Middle School, Verdugo Hills Senior High School, and Plainview Academic Charter Academy.
Ownership History
Date
Name
Owned For
Owner Type
Purchase Details
Closed on
Aug 29, 2006
Sold by
Sanchez Lucila
Bought by
Sanchez Eduardo
Current Estimated Value
Home Financials for this Owner
Home Financials are based on the most recent Mortgage that was taken out on this home.
Original Mortgage
$480,000
Outstanding Balance
$289,669
Interest Rate
6.76%
Mortgage Type
New Conventional
Estimated Equity
$550,879
Purchase Details
Closed on
Aug 26, 2005
Sold by
Sanchez Eduardo and Sanchez Lucila
Bought by
Sanchez Eduardo
Home Financials for this Owner
Home Financials are based on the most recent Mortgage that was taken out on this home.
Original Mortgage
$400,000
Interest Rate
1%
Mortgage Type
New Conventional
Purchase Details
Closed on
Jun 1, 1996
Sold by
Cappon Suzanne C
Bought by
Sanchez Eduardo and Sanchez Lucila
Home Financials for this Owner
Home Financials are based on the most recent Mortgage that was taken out on this home.
Original Mortgage
$82,450
Interest Rate
8.09%
Create a Home Valuation Report for This Property
The Home Valuation Report is an in-depth analysis detailing your home's value as well as a comparison with similar homes in the area
Home Values in the Area
Average Home Value in this Area
Purchase History
| Date | Buyer | Sale Price | Title Company |
|---|---|---|---|
| Sanchez Eduardo | -- | Accommodation | |
| Sanchez Lucila | -- | Chicago Title Co | |
| Sanchez Eduardo | -- | Ticor Title Co Glendale | |
| Sanchez Eduardo | $85,000 | Fidelity Title | |
| Cappon Suzanne C | -- | Fidelity Title |
Source: Public Records
Mortgage History
| Date | Status | Borrower | Loan Amount |
|---|---|---|---|
| Open | Sanchez Lucila | $480,000 | |
| Closed | Sanchez Eduardo | $400,000 | |
| Closed | Sanchez Eduardo | $82,450 |
Source: Public Records
Tax History Compared to Growth
Tax History
| Year | Tax Paid | Tax Assessment Tax Assessment Total Assessment is a certain percentage of the fair market value that is determined by local assessors to be the total taxable value of land and additions on the property. | Land | Improvement |
|---|---|---|---|---|
| 2025 | $2,734 | $210,868 | $99,324 | $111,544 |
| 2024 | $2,734 | $206,734 | $97,377 | $109,357 |
| 2023 | $2,684 | $202,681 | $95,468 | $107,213 |
| 2022 | $2,564 | $198,708 | $93,597 | $105,111 |
| 2021 | $2,527 | $194,812 | $91,762 | $103,050 |
| 2019 | $2,454 | $189,037 | $89,042 | $99,995 |
| 2018 | $2,363 | $185,332 | $87,297 | $98,035 |
| 2016 | $2,245 | $178,137 | $83,908 | $94,229 |
| 2015 | $2,214 | $175,462 | $82,648 | $92,814 |
| 2014 | $2,229 | $172,026 | $81,030 | $90,996 |
Source: Public Records
Map
Nearby Homes
- 7848 Forsythe St
- 7755 Forsythe St
- 7851 Fenwick St
- 10623 Woodward Ave
- 8110 Brownstone St
- 10529 Mount Gleason Ave
- 7541 Hillrose St
- 10917 Tujunga Canyon Blvd
- 8230 Hillrose St
- 7815 Denivelle Rd
- 10554 Plainview Ave
- 10621 Helendale Ave
- 10404 Leolang Ave
- 0 Rim Canyon Rd Unit SR25228396
- 7844 Rim Canyon Rd
- 11034 Scoville Ave
- 10430 Mcvine Ave
- 10743 Mountair Ave
- 10429 Mcvine Ave
- 10704 Oro Vista Ave
- 7853 Jayseel St
- 7863 Jayseel St
- 7849 Jayseel St
- 7847 Jayseel St
- 7901 Jayseel St
- 7845 Jayseel St
- 7856 Forsythe St
- 7841 Jayseel St
- 7900 Forsythe St Unit 7900 Forsythe
- 7900 Forsythe St
- 7844 Forsythe St
- 7905 Jayseel St
- 7839 Jayseel St
- 7856 Jayseel St
- 7902 Forsythe St
- 7850 Jayseel St
- 7860 Jayseel St
- 7908 Forsythe St
- 7900 Jayseel St
- 7844 Jayseel St