K
Seller's Agent in 2026
Kathy Wilson
My Home Group
(480) 204-6122
26 Total Sales
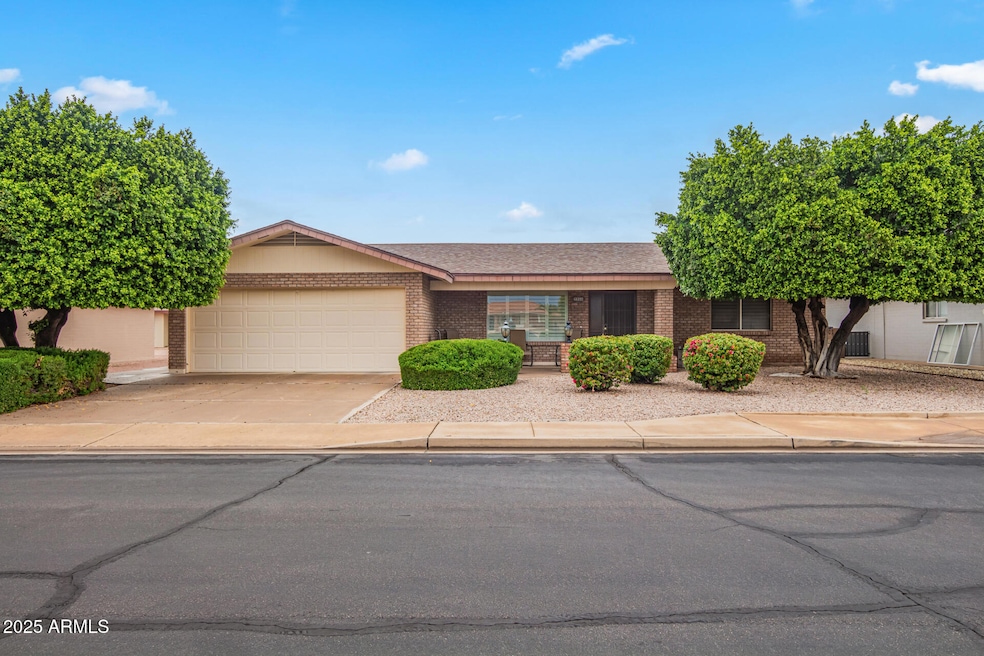
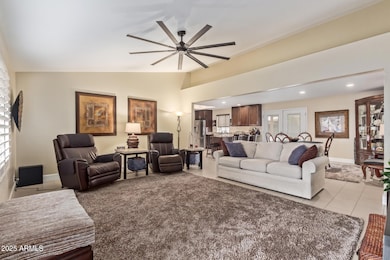
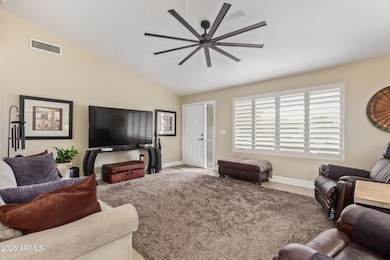
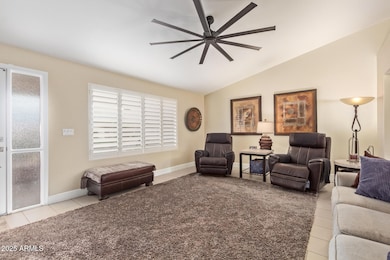
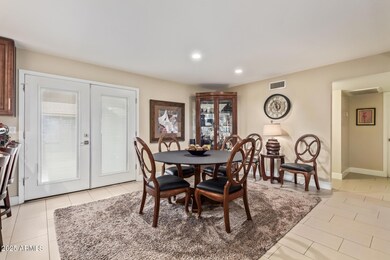
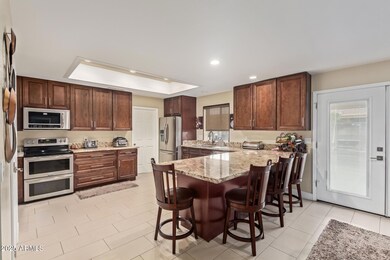
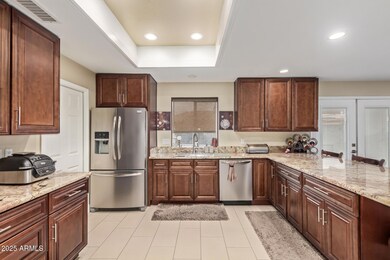
BUYER COULD NOT PERFORM. IMMACULATE 2-bedroom home located in the vibrant 55+ community of Sunland Village East! Inside, you'll love the open floorplan,plantation shutters, vaulted ceilings, tile floors in all the right places, living room perfect for relaxing or entertaining that opens up the the dining/kitchen.The kitchen invites you to unleash your inner chef with stainless steel appliances, granite counters, chocolate-stained cabinets, a breakfast bar, and a pantry. Functionality shines in the oversized laundry room. The primary bedroom offers direct access to the backyard along with a private bathroom featuring dual sinks and a handy makeup vanity. Sip your favorite beverage in the serene private backyard and enjoy peaceful mornings or cool evenings. Community amenities include but n limited to pool time, golf, tennis, pickleball, fitness center, shuffleboard, hobby room and so much more! Basically a vacation in your backyard! Do not miss this property, you will not be disappointed!
Last Agent to Sell the Property
My Home Group Real Estate License #SA117342000 Listed on: 11/21/2025

| Date | Type | Sale Price | Title Company |
|---|---|---|---|
| Warranty Deed | $440,000 | Fidelity National Title Agency | |
| Deed | -- | None Listed On Document | |
| Warranty Deed | -- | Scotts Docs Llc | |
| Warranty Deed | -- | -- | |
| Interfamily Deed Transfer | -- | -- | |
| Cash Sale Deed | $116,064 | Transamerica Title Ins Co |
| Date | Event | Price | List to Sale | Price per Sq Ft |
|---|---|---|---|---|
| 03/09/2026 03/09/26 | Sold | $440,000 | -4.3% | $265 / Sq Ft |
| 02/24/2026 02/24/26 | Pending | -- | -- | -- |
| 01/03/2026 01/03/26 | For Sale | $460,000 | 0.0% | $277 / Sq Ft |
| 12/23/2025 12/23/25 | Off Market | $460,000 | -- | -- |
| 11/21/2025 11/21/25 | For Sale | $460,000 | -- | $277 / Sq Ft |
| Year | Tax Paid | Tax Assessment Tax Assessment Total Assessment is a certain percentage of the fair market value that is determined by local assessors to be the total taxable value of land and additions on the property. | Land | Improvement |
|---|---|---|---|---|
| 2025 | $1,881 | $25,398 | -- | -- |
| 2024 | $1,825 | $24,189 | -- | -- |
| 2023 | $1,825 | $28,680 | $5,730 | $22,950 |
| 2022 | $1,781 | $24,320 | $4,860 | $19,460 |
| 2021 | $1,929 | $22,370 | $4,470 | $17,900 |
| 2020 | $1,895 | $20,250 | $4,050 | $16,200 |
| 2019 | $1,757 | $19,020 | $3,800 | $15,220 |
| 2018 | $1,672 | $18,250 | $3,650 | $14,600 |
| 2017 | $1,620 | $17,870 | $3,570 | $14,300 |
| 2016 | $1,680 | $16,750 | $3,350 | $13,400 |
| 2015 | $1,540 | $16,280 | $3,250 | $13,030 |
K
Seller's Agent in 2026
Kathy Wilson
My Home Group
(480) 204-6122
26 Total Sales
Buyer's Agent in 2026
Joan Lucas
RealtyONEGroup Mountain Desert
(928) 421-1368
36 Total Sales
Source: Arizona Regional Multiple Listing Service (ARMLS)
MLS Number: 6950150
APN: 309-02-692
Disclaimer: Certain information contained herein is derived from information provided by parties other than Homes.com. All information provided is deemed reliable, but is not guaranteed to be accurate and should be independently verified.
![]() All information should be verified by the recipient and none is guaranteed as accurate by ARMLS
All information should be verified by the recipient and none is guaranteed as accurate by ARMLS
Listing Information presented by local MLS brokerage: Ten-X, local REALTOR®- Arlene Richardson - (888)-952-6393
Ask me questions while you tour the home.