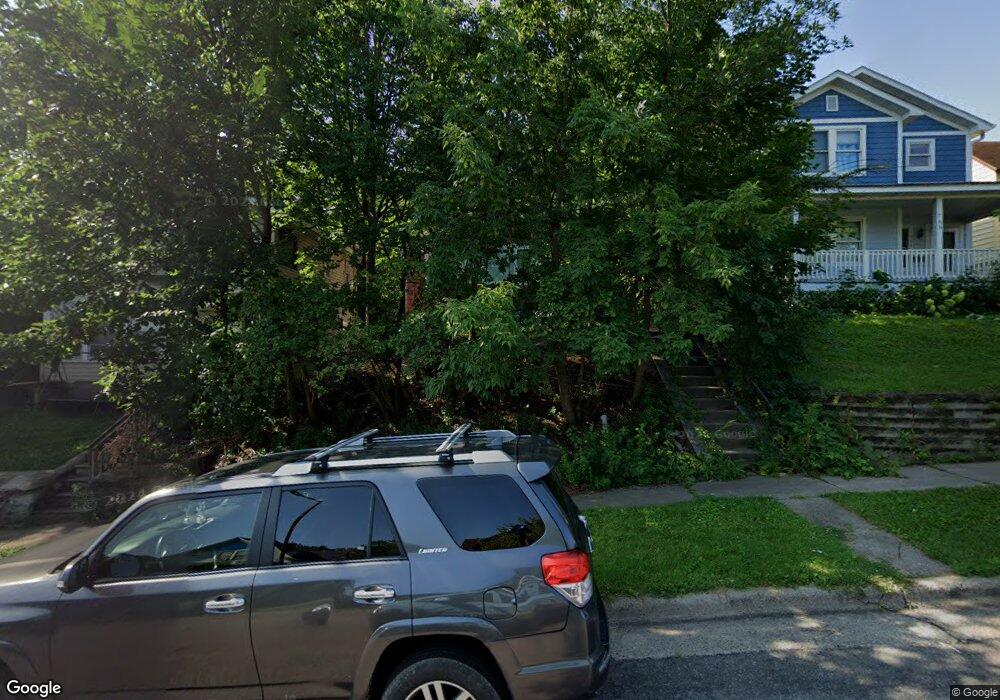
788 Sims Ave Saint Paul, MN 55106
Payne-Phalen NeighborhoodEstimated Value: $132,000 - $200,000
1
Bed
1
Bath
884
Sq Ft
$194/Sq Ft
Est. Value
About This Home
This home is located at 788 Sims Ave, Saint Paul, MN 55106 and is currently estimated at $171,155, approximately $193 per square foot. 788 Sims Ave is a home located in Ramsey County with nearby schools including John A.Johnson Achievement Plus Elementary School, Creative Arts Secondary School, and Washington Technology Magnet School.
Ownership History
Date
Name
Owned For
Owner Type
Purchase Details
Closed on
Feb 1, 2024
Sold by
Cassidy Michael
Bought by
Flores Amilcar
Current Estimated Value
Purchase Details
Closed on
May 23, 2001
Sold by
Johnson David R
Bought by
Stevens Mike C
Purchase Details
Closed on
Jan 2, 2001
Sold by
Thatcher Jeffrey A and Thatcher Anna M
Bought by
Johnson David R
Purchase Details
Closed on
Oct 22, 1999
Sold by
Opatz Nate
Bought by
Thatcher Jeffrey A and Thatcher Ann M
Purchase Details
Closed on
Jun 1, 1998
Sold by
Gilbert William G and Gilbert Irma H
Bought by
Opatz Peter and Opatz Nathan
Create a Home Valuation Report for This Property
The Home Valuation Report is an in-depth analysis detailing your home's value as well as a comparison with similar homes in the area
Home Values in the Area
Average Home Value in this Area
Purchase History
| Date | Buyer | Sale Price | Title Company |
|---|---|---|---|
| Flores Amilcar | $130,000 | -- | |
| Flores Amilcar | $130,000 | -- | |
| Stevens Mike C | $36,400 | -- | |
| Johnson David R | $24,000 | -- | |
| Thatcher Jeffrey A | $44,000 | -- | |
| Opatz Peter | $31,500 | -- |
Source: Public Records
Mortgage History
| Date | Status | Borrower | Loan Amount |
|---|---|---|---|
| Closed | Stevens Mike C | -- |
Source: Public Records
Tax History Compared to Growth
Tax History
| Year | Tax Paid | Tax Assessment Tax Assessment Total Assessment is a certain percentage of the fair market value that is determined by local assessors to be the total taxable value of land and additions on the property. | Land | Improvement |
|---|---|---|---|---|
| 2025 | $3,434 | $193,300 | $25,000 | $168,300 |
| 2023 | $3,434 | $183,400 | $20,000 | $163,400 |
| 2022 | $3,240 | $190,000 | $20,000 | $170,000 |
| 2021 | $2,790 | $148,900 | $20,000 | $128,900 |
| 2020 | $2,550 | $131,900 | $7,000 | $124,900 |
| 2019 | $2,058 | $124,200 | $7,000 | $117,200 |
| 2018 | $1,748 | $105,700 | $7,000 | $98,700 |
| 2017 | $1,724 | $94,500 | $7,000 | $87,500 |
| 2016 | $1,658 | $0 | $0 | $0 |
| 2015 | $1,686 | $80,500 | $7,000 | $73,500 |
| 2014 | $1,616 | $0 | $0 | $0 |
Source: Public Records
Map
Nearby Homes