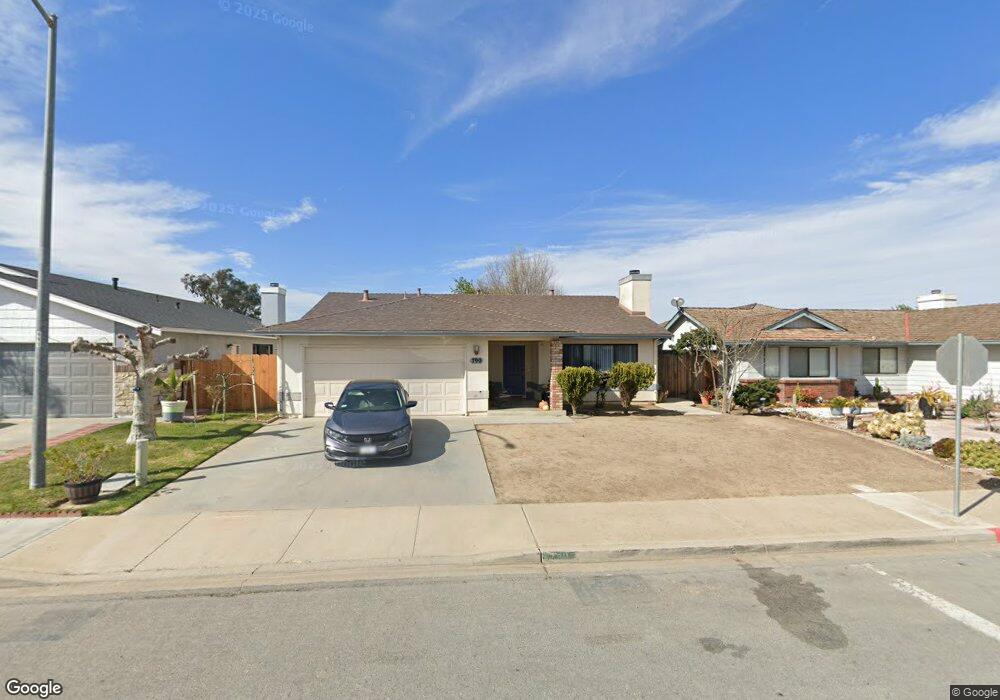
790 Dart Way Greenfield, CA 93927
Estimated Value: $518,827 - $565,000
3
Beds
2
Baths
1,505
Sq Ft
$362/Sq Ft
Est. Value
About This Home
This home is located at 790 Dart Way, Greenfield, CA 93927 and is currently estimated at $544,707, approximately $361 per square foot. 790 Dart Way is a home located in Monterey County with nearby schools including Cesar Chavez Elementary School, Vista Verde Middle School, and Greenfield High School.
Ownership History
Date
Name
Owned For
Owner Type
Purchase Details
Closed on
Jun 19, 2008
Sold by
Countrywide Bank Fsb
Bought by
Muster Corp
Current Estimated Value
Purchase Details
Closed on
Apr 16, 2008
Sold by
Trujillo Salvador and Trujillo Josefina
Bought by
Countrywide Bank Fsb
Purchase Details
Closed on
Sep 23, 1994
Sold by
Bryce John T
Bought by
Trujillo Salvador and Trujillo Josefina
Home Financials for this Owner
Home Financials are based on the most recent Mortgage that was taken out on this home.
Original Mortgage
$99,750
Interest Rate
8.58%
Purchase Details
Closed on
Feb 1, 1994
Sold by
Bryce Agnes C
Bought by
Bryce John Y
Home Financials for this Owner
Home Financials are based on the most recent Mortgage that was taken out on this home.
Original Mortgage
$96,400
Interest Rate
4.62%
Create a Home Valuation Report for This Property
The Home Valuation Report is an in-depth analysis detailing your home's value as well as a comparison with similar homes in the area
Home Values in the Area
Average Home Value in this Area
Purchase History
| Date | Buyer | Sale Price | Title Company |
|---|---|---|---|
| Muster Corp | $150,000 | First American Title Company | |
| Countrywide Bank Fsb | $264,350 | First American Title | |
| Trujillo Salvador | $133,000 | Chicago Title Company | |
| Bryce John Y | -- | Stewart Title |
Source: Public Records
Mortgage History
| Date | Status | Borrower | Loan Amount |
|---|---|---|---|
| Previous Owner | Trujillo Salvador | $99,750 | |
| Previous Owner | Bryce John Y | $96,400 |
Source: Public Records
Tax History Compared to Growth
Tax History
| Year | Tax Paid | Tax Assessment Tax Assessment Total Assessment is a certain percentage of the fair market value that is determined by local assessors to be the total taxable value of land and additions on the property. | Land | Improvement |
|---|---|---|---|---|
| 2025 | $2,418 | $193,147 | $90,135 | $103,012 |
| 2024 | $2,418 | $189,361 | $88,368 | $100,993 |
| 2023 | $2,515 | $185,649 | $86,636 | $99,013 |
| 2022 | $2,419 | $182,010 | $84,938 | $97,072 |
| 2021 | $2,318 | $178,442 | $83,273 | $95,169 |
| 2020 | $2,409 | $176,614 | $82,420 | $94,194 |
| 2019 | $2,354 | $173,152 | $80,804 | $92,348 |
| 2018 | $2,295 | $169,758 | $79,220 | $90,538 |
| 2017 | $2,157 | $166,430 | $77,667 | $88,763 |
| 2016 | $2,183 | $163,168 | $76,145 | $87,023 |
| 2015 | $1,981 | $160,718 | $75,002 | $85,716 |
| 2014 | $1,941 | $157,570 | $73,533 | $84,037 |
Source: Public Records
Map
Nearby Homes
- 42050 El Camino Real
- 701 El Camino Real
- 405 Primavera Ct
- 434 Oak Ave
- 717 Oak Ave
- 215 10th St
- 273 Merlot Ave
- 1102 Pinnacles Ave
- 237 Bianco Way
- 5 6th St
- 1183 Oak Ave
- 223 Apple Ave
- 15 Elmwood Dr
- 209 Sirrah Way
- 0 Elm Ave
- 12 Huerta St
- 207 San Antonio Dr
- 217 San Simeon Ct
- 41460 Los Coches Rd
- 43002 Arroyo Seco Rd